


In my last article on tools for helping with pricing I talked about the importance of using your variable costs to understand the minimum price you can charge without losing money on every extra sale of a product you make (see “Tools to help you put the right price on your products,” from the February 2022 GFM). I gave examples of those variable costs, but I didn’t explain how I track those costs and inevitably I got responses asking for suggestions. I also think it may be helpful to expand here on what I consider a variable cost and what kind of analysis I use them for.
I find the concept of variable costs most useful in the context of trying to predict the future. By collecting data on what my variable costs have been in the past, I have a better chance of getting a prediction of the future – but it’s just a prediction so I don’t want to use extreme examples from the past. I want to understand on average what typically happens, and also what the possible range is. Along with understanding the range it’s helpful to have an idea of how likely it is that I’ll be close to the average, or if it’s just as likely that the worst-case scenario will happen.
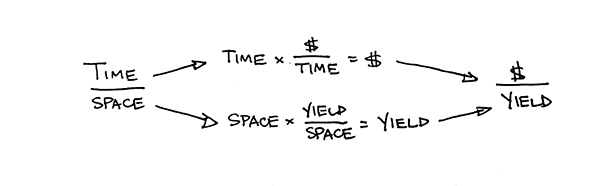
Time per space can be converted to dollars per unit (yield), by multiplying the time by the dollars per time (typically this is done with time in units of hours) and multiplying the space by yield per space.
Because I’m just looking for an average and I don’t want to spend all of my time on the farm writing down every detail of everything we do and then trying to analyze all of that data, I’ve settled on doing occasional time studies for the tasks I want to have numbers for. The past is an indication of the future, but the future is not going to be exactly like the past, so I don’t need perfect accuracy, I need a good estimation.
Variable costs, by definition, are rates of change, usually expressed in dollars per unit of crop. Sometimes instead of dollars per unit of crop (e.g. $/bunch or $/lb) the cost is time per unit. Ultimately time can be assigned a cost (labor rate), and so you can convert time per unit of crop (lbs, count, bunch…) into dollars per unit of crop. Another frequent variation is time or dollars per unit of space (beds, row feet, acres…) Using a yield number (units of crop produced per space) you can convert dollars per unit of space into a dollars per unit of crop. In the end, when you add up all of your variable costs you need to be adding numbers that all have the same units, and those units should be dollars per unit of crop.
Non-labor variable costs
Non-labor variable costs, things like seed costs, are relatively easy to track. The cost of fertility for one bed is relatively simple to calculate knowing how much your amendments cost and how much you put on a bed. Other non-labor variable costs are things like drip tape, and if you use your tape for multiple years, you can just divide the cost of the tape by the number of years of use you get out of it. You’ll probably find that variable costs inputs for most crops are a relatively small part of the cost of production.
Seed is an interesting example of a variable cost that can go down when increasing the volume that you’re buying. Typically when you order larger quantities of seed at once the price per seed goes down, and seed cost is a variable cost. Seeds don’t last forever though, so if you find yourself always ordering more see than you end up using before it expires, that extra seed that doesn’t get used ends up being a fixed cost. Ultimately you want to reduce your variable costs and your fixed costs if possible so buy in bulk to reduce seed costs, but only if it’s not adding more fixed cost than what you’re saving in variable costs.
If you’re already keeping receipts of purchases for your tax records, which you need to be anyway, and you’re tracking where those expenses are being used on the farm with production records that show how much you’re growing of each crop and what inputs are being used in what quantities on each crop, then you already have the information you need to calculate non-labor variable costs. It may still take you a little time to separate out which costs are variable, and which are fixed. And it may take you a little more time to figure out how much cost is associated with a unit of any one crop, but the numbers are all there in your records.
As an example, when we buy and apply compost to the fields I have a receipt for how much the compost cost and I have a record of how much got spread on what beds. I can divide the total cost of the compost by the number of beds it was spread on (we spread the same amount on every bed) and the I have a cost per bed – and for any crop I have a yield per bed number for I can convert that to a cost per unit of crop.
For something like row cover that might get used for more than one season, but has a pretty finite lifespan, I can divide the cost per bed by the number of years of use I get out of the row cover. If it lasts three crop cycles, I simply divide the cost per bed of fabric by three to get the cost per bed for one crop. Again, this doesn’t have to be exact, it just needs to be a good average, with some sense of how much variation there might be.
Labor
For most crops on small farms, the majority of the expense of growing the crop is labor. The variable costs from labor are a little harder to track than non-labor variable costs. To find variable costs from labor I use time studies.
When I’m doing a time study myself, I usually start the stopwatch on my phone, do whatever task it is I’m trying to accomplish, and then try to remember to stop the stopwatch when I’m finished. In order to have this be a useful time study I need to then write down that time, as well as the amount of whatever it was that I did in that time was.
If I’m doing a time study on harvest I’m writing down how much I harvested in that time. If I’m hoeing a bed I”m writing down how much space I hoed in that time. The way I’ve mostly done this is by using the notes app on my phone and creating a special folder for time studies. For each one of these I’ll also note the date of the time study, whether I thought it was average, fast, or slow, and if there were any other special circumstances. Later, when I’m in the office, I can transfer the notes into a spreadsheet where I keep all of my time studies.
For any given task I like to have at least three time studies, and then I’ll average those three. They’ll also give me some sense of the range of time that task might take to accomplish depending on conditions. With any time study it’s best to do larger chunks of time rather than smaller ones so that you’re getting a good average of the pace within the individual time study. I then average the rates, meaning if I had three time studies on hoeing, one where it took 20 minutes to hoe one bed, another where it took 75 minutes to hoe five beds and a third where it took 88 minutes to hoe 4 beds, I would first get a rate per bed for each of those time studies: 20min/bed, 15min/bed and 22min/bed. Then I would average the three rates to get 19 min/bed. I find this slightly more representative than adding the times and beds of the three time studies and then getting a rate, which in this example would be 18.3 min/bed.
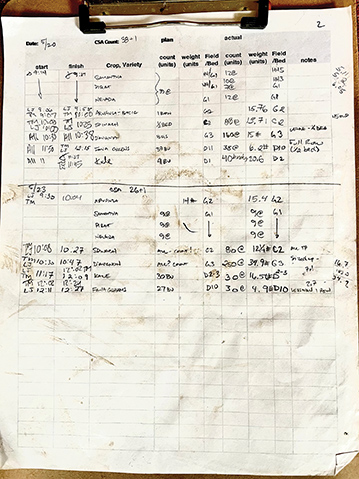
This is an example of one of the harvest sheets we use that has been filled out. I started by entering the crop and variety and the columns under the plan section. As we harvested we filled in the start, finish, actual and notes sections. This is two different days of harvest on one sheet, and you can see that we didn’t actually capture the time it took to harvest the lettuces (Samantha, Pirat and Nevada) on the second day, but we do have that information from the first day of harvest. The notes on the D’Avignon and Fava Greens from the first day let us know how much of the bed we harvested which allows us to get a yield per bed directly from those entries. For the other crops we have to wait until we’ve completed harvests and add up totals to compare to the amount of space planted in order to get a good yield number.
I haven’t been organized enough to set up a google form for collecting time studies, but I have worked with others who have and they’ve created forms I’ve used. To use the form I created a shortcut to the form on my smartphone. Using the shortcut I could quickly access the form and just fill in the form any time I did a time study. Google forms, especially when set up well, will feed results directly into a useable spreadsheet. I find it takes a little longer to enter the data this way than with the notes feature, but it saves the step of transferring the data to a spreadsheet later. One of the reasons I’ve kept using the notes is that I tend to have less time in the field for note taking and more time in the office. I used to actually use a pen and notecard (with a nod to Chris Blanchard here – it was a space pen and an index card) and this is the fastest, but at some point I ran out of index cards and never got more so it’s been back to my smartphone which I always have on me these days.
If there are multiple people involved in a time study, it’s important to capture all of their time and how much they accomplished as a group in that time. For example, if three people are all hoeing one bed and it takes them 5 minutes, the time note would be 3 x 5 minutes, or 15 minutes total to hoe a bed.
What labor cost to use
When converting the amount of time it takes to do a task into the dollars it takes, you need to use the dollars per hour paid to do that task. In this case you want to use the average dollars per hour that it would cost the farm, meaning if you have farm labor that’s paid at different hourly rates it would be the average of those rates – and you want to use what is called the loaded wage rate; not what the employee gets paid, but what it costs the farm when taxes, insurance and any benefits are included.
Harvest records
In addition to time studies for gathering harvest rates, we also need to have good yield information in order to understand how much produce will likely come from a given planted space. I like to create to-do lists that also double as record sheets, reducing the amount of writing people need to do to create the record. The harvest sheets we use on our farm are a good example of this. They are both the picking list for the day, and the record of how much was harvested, where it came from, who did it, and how long it took. In the unlikely event that you ever have a food borne illness traced back to your farm, it’s good to have records of where every harvest came from, and that information is also useful for tracking yield data. Yield data is essential for future planning, and for being able to understand the costs and revenues associated with a planting of a crop.
Record forms
Good record sheets, whether they’re paper or electronic, need to be explicit about what it is that should be entered. This is a reminder to whoever is making the record of what, and how, they need to record the information for it to be useful. For this reason, when I want a record kept, I make a special record sheet with columns for each item I want to have recorded to make it as obvious as possible. I try not to include any columns that aren’t necessary – those would just create extra work without adding relevant information. That extra work isn’t just extra work for the person writing down the record, it’s also extra work for the person reading the record and trying to interpret it.
Accuracy
Don’t get too caught up in the accuracy of calculating any of these numbers – remember that they are all being used to guess what will happen in the future, so there’s inevitably going to be some slop. This also means that any number you calculate is plus or minus some amount. Most often that plus or minus range is the difference between making money on a crop, or losing money, so when you’re making your calculations run some scenarios of what would happen if it’s a bad season and the numbers are a little low, as well as if it’s a good season and the numbers are a little high, and then do everything you can to keep the numbers on the high side over the course of the season, now with a better understanding of what will happen if you don’t.
Josh Volk farms in Portland, Oregon, and does consulting and education under the name Slow Hand Farm. He is the author of the book Build Your Own Farm Tools and Compact Farms: 15 Proven Plans for Market Farms on 5 Acres or Less, both available from Growing for Market. He can be found at SlowHandFarm.com.
Copyright Growing For Market Magazine.
All rights reserved. No portion of this article may be copied
in any manner for use other than by the subscriber without
permission from the publisher.