


New web-based program helps track crop-specific labor costs
One of the most common questions I hear both new and experienced farmers asking is, “what crops should I grow to be successful?” There are multiple layers to this question, but one of the fundamental ones for anyone trying to make a farm business successful is which crops are going to contribute the most to making the farm a profitable business? And since most market farms aren’t just growing one or two crops, the question is not just which one crop to grow but what mix of crops will be the best? This is the question that the Know Your Cost To Grow program is focused on and helps farmers answer.
The KYCTG program is multifaceted and includes a web-based costing tool application for helping make calculations, detailed directions for collecting the basic data needed, and a step-by-step framework for using the results to make good business decisions. It was created through a partnership between Oregon Tilth and the Oregon State University Center for Small Farms & Community Food Systems, and is a program that Tanya Murray has been developing for the past ten years. KYCTG is the result of nearly a decade of extensive research into approaches for cost analysis specifically for multi-product businesses. Importantly, it is also informed by Tanya’s long-time, hands-on farming experience and has included input from many other farmers from the very beginning.
In the 90’s and 00’s Tanya worked on market farms in Oregon, Connecticut, and California, for many years doing field work and eventually managing one of the most established market farms in the Portland, Oregon, area. In her time on that farm, they grew from 9 to 16 acres in production, supplying a 400-member CSA and many restaurant and direct-to-retail accounts. As Tanya wrestled with identifying the optimal scale, market channel mix and crop mix for the farm she realized she needed more tools for business decision making and might benefit from going back to school to study business management. She did just that and has been focused on bringing that information back to the market farming community ever since.
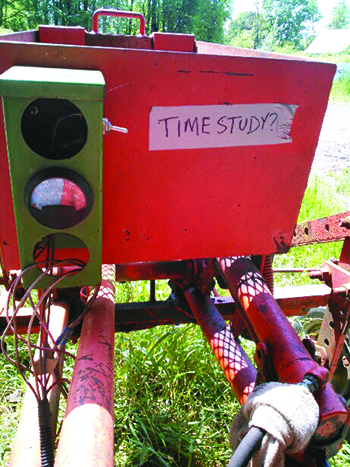 Incorporating the record keeping into the everyday activities on the farm and placing little physical reminders in the places where the activities are done are two of the tips KYCTG gives for actually collecting the data you need to do your analysis. Importantly, it has you think this through and set it up before the season starts, helping ensure the records actually get recorded during the season when things are busy. Shown here is a little tape label on a cultivating tractor at Persephone Farm in Oregon. It reminds the driver every time they get on the seat of the tractor that they might need to record a time for whatever it is they’re about to do. Photo by Theo Ciszewski.
KYCTG puts a big emphasis on accounting for crop-specific labor costs, almost always the largest direct cost in producing any crop. This can be a daunting part of crop costing for market farms that grow upwards of 30 to 40 different crops. For my farm, labor is absolutely my biggest cost coming in at 75-85% of my total expenses depending on the year. This number includes paying myself for my own labor as the owner, an important part of the analysis. Even without my own labor on my small farm, labor costs still represent the largest single expense.
In KYCTG the process for accounting for crop-specific labor costs starts with identifying the production steps involved in growing crops and then conducting simple time studies to capture the labor required for each of those steps. These time studies are used to calculate labor activity rates that are then applied to the crops depending on the specific labor activities (steps) to produce each crop.
Because this method uses average rates for labor instead of trying to capture the details of every minute worked on the farm, it significantly reduces the amount of record keeping necessary and arguably gives a better view of the overall picture. Even though it uses average rates, it also allows you look at how much variation you might expect by allowing you to run scenarios with high or low numbers.
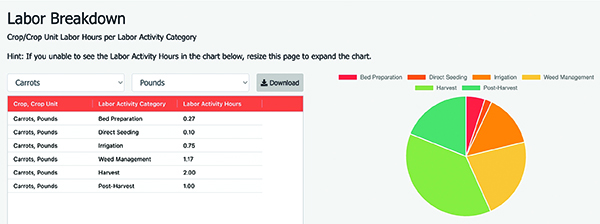 In the analysis section of KYCTG you can zoom in on the specific labor costs that go into producing a crop. Here you can see that harvest is the largest single labor cost on this farm. This gives a clue that there are more potential cost savings by looking at ways to decrease harvest labor than in any other area. That doesn’t mean it’s the only potential place, but you can easily see that even a small savings in harvest labor would completely outweigh any small savings in the direct seeding or irrigation labor cost.
The approach also saves time because it turns out that the labor activity rate for many production steps is the same regardless of the crop that’s being produced. An example of this on my own farm is that it takes me exactly the same amount of time to seed 100 row feet of carrots as it takes me to see 100 row feet of turnips with a Jang seeder. If I determine the rate for seeding one of these two, I can safely use it for the other crop without having to do another time study. And, it’s a proportional rate, so if I know how much time it takes to seed 100 feet, I can easily estimate how much time it would take if I seeded 200 feet instead, or any number of feet of any crop with the Jang.
The KYCTG program also addresses another big hurdle most farmers that want to analyze crop costs face – how to create systems for and develop the habit of actually taking the records needed. The program digs into the details of what units to use for time study records; what to include in time study records and what you can leave out. KYCTG does a good job of walking you through the details for collecting the labor numbers you need before the growing season gets started, making it much more likely to actually get done, and that nothing critical will get missed.
Once you’ve done your time studies and plugged your records into the KYCTG web-based costing tool, the information you enter gets used to calculate estimates for what individual crops are costing you to grow. The costing tool is also set up to look at how potential changes to the way you produce a crop would change how much it costs to grow it. The pie charts that the KYCTG analysis tool gives make it easy to see which expenses are the most significant, and it breaks down the labor hours into the different production steps that go into producing a crop. This gives important clues to the areas with the biggest opportunities for potential cost savings.
The costing tool is designed so it is easy to run scenarios to look at how different production changes might affect how much a crop contributes to farm profit. I used this feature when looking for a way to address problems I was having on the farm with a new pest, brassica white fly. In the past I had been able to do a single planting of kale in the spring, harvest leaves to make bunches through the spring and early summer, ignore it for the hot months of summer, and then harvest it again all through the fall and even into the winter.
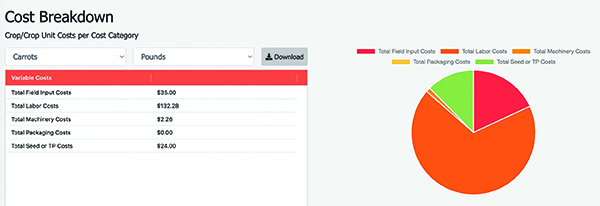
In the analysis section of KYCTG you can look at the relative size of each of your cost categories. Here you can see that labor costs far outweigh machinery costs for carrot production and are nearly ¾ of the total costs.
When brassica white fly became a problem in our area a few years ago, the first harvest or two was still fine, but after that there was so much pest pressure that I was never able to harvest many good leaves even though the plants still grew. By running scenarios on kale planting options using the KYCTG costing tool, I was able to look at what the cost differences would be if I started growing it more like head lettuce, with many successions of slightly higher density plantings each harvested all in one go. The tool was able to show me that I could potentially grow it with similar cost due to the reduced harvest time, even though I would be increasing all of the associated planting costs. I’ve been using the new method for a few years now and it’s significantly sped up our harvest and reduced any problems with white fly.
The pie charts that the KYCTG analysis tool gives make it easy to see which expenses are the most significant, and it breaks down the labor expenses as well. This gives important clues to the areas with the biggest opportunities for potential cost savings. Running numbers like these on potatoes years ago on a larger market farm I was working on, I realized that if we scaled up our potato production to meet wholesale demand by buying a potato digger, the digger, which felt expensive at the time, could actually save us so much on labor it would pay for itself in savings in less than a year, even selling at the wholesale price which was less than half of what we were able to retail smaller quantities of potatoes for.
One thing that I’ve found to be unique about KYCTG is that it doesn’t have you assign indirect or overhead costs to individual crops. This includes some production labor that is shared between multiple crops – think transition time and travel time – along with some traditional business overheads. Even though it’s tempting to think that you need to allocate these costs, it turns out that it’s not actually helpful when analyzing individual crops, and for the most part it’s actually skewing results in ways that are unhelpful when it is included. This is one of the important differences I see with the KYCTG program over others; it does not attempt “full costing”, and as a result it’s actually both easier to collect good numbers for and the resulting analysis is more useful.
While the KYCTG tool can help with analysis of individual crops as in the examples above, it was designed with analyzing crop mixes for farms that are growing many different crops, 20 or 40 or even more. It takes most farms more than one season to collect data on all of the crops they grow, but the methods employed in KYCTG mean that for every additional crop you add to the program, the amount of data you need to collect goes down since there is so much overlap between most crops in the operations that are done to produce the crops. Once you have complete labor numbers for a handful of crops you may only need to collect harvest and packing specific labor data for the rest of them, and I’ve actually found these to be the easiest numbers to track. The numbers that overlap, like basic bed preparation and irrigation are already in the tool and don’t need to be entered again, just referenced from the drop down.
Diversified vegetable farmers that want to get started with KYCTG in 2024 can sign up for a free virtual workshop series that will be offered this winter. This series and the ongoing KYCTG program is funded by a grant from the USDA’s Beginning Farmer and Rancher Development Program. The target audience for the workshop series (and for KYCTG) is diversified vegetable farmers who are established enough to have a good understanding of the basic systems they are using to produce the individual crops on their farms. Having this understanding is important for being able to complete the first step in the process of collecting data: the process of identifying each of the individual steps it takes to produce a crop. To learn more and sign up, check out knowyourcosttogrow.com.
Full disclosure, Tanya and I have been partners for 24 years, so I’ve seen this full arc play out in real time and have probably benefitted more than anyone else from endless discussions with her on this very topic. I took part in the initial cohort of farmers that trialed early versions of her system and have been using the results ever since. You can see her influence in the article on pricing in the February 2022 GFM and if you dig into KYCTG you’ll see the overlap.
While KYCTG was designed specifically for vegetable operations growing a wide range of crops and at this point Tanya has her hands full addressing that need, it is possible to use the tool and the principles it’s built on for other types of crops. Lennie Larkin of B-Side Farm has been working with Tanya and a group of experienced flower growers with funding from Western SARE to try the approach with cut flower growing. The tool is set up for annual vegetable production, but I can see that with some creative workarounds, it could also be used to look at biennials and even perennials like tree fruit and nuts.
Josh Volk farms in Portland, Oregon, and does consulting and education under the name Slow Hand Farm. He is the author of the books Compact Farms: 15 Proven Plans for Market Farms on 5 Acres or Less, and Build Your Own Farm Tools, Equipment & Systems for the Small-Scale Farm & Market Garden, both available from Growing for Market. He can be found at SlowHandFarm.com.
Copyright Growing For Market Magazine.
All rights reserved. No portion of this article may be copied
in any manner for use other than by the subscriber without
permission from the publisher.