


Many years ago, I took my family on a road trip to the Grand Canyon and the beautiful red rocks of Utah. Highways in this part of the country are desolate with long stretches between exits. I still remember when we missed a critical fork in the road because my GPS service was spotty. As our exit suddenly appeared, I hesitated and missed the interchange, only to discover it was 25 miles to the next exit. We added a costly hour to our trip that day.
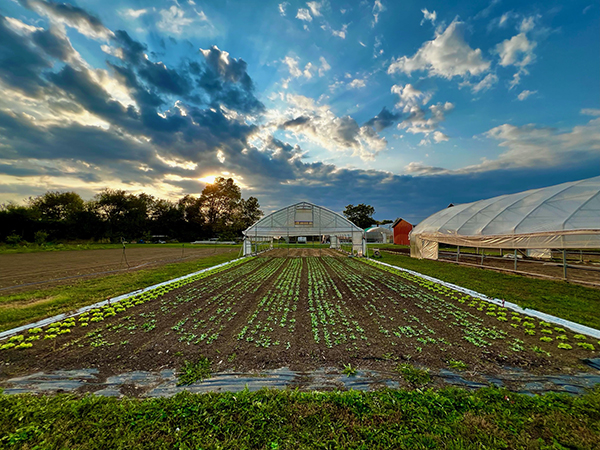
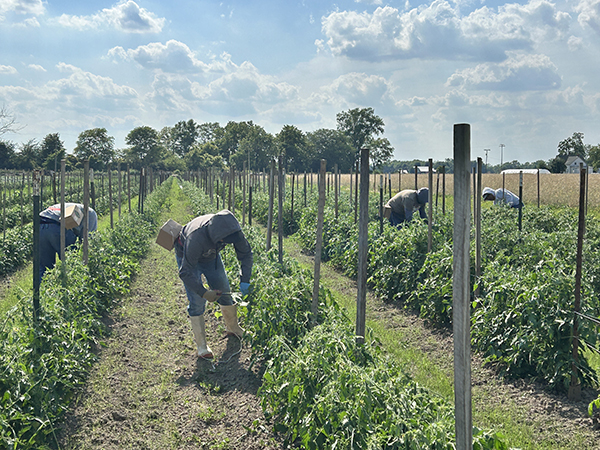
The author and her family run Shared Legacy Farms in Elmore, Ohio.
When it comes to tracking farm revenue, it’s easy to lose your way when you don’t have clear coordinates to track your progress and guide your decisions. If you’re like many direct to consumer farmers, tracking marketing and sales data often takes a backseat to the day-to-day production demands of running a farm. The result: we end up driving blind, heading in the wrong direction, and wasting valuable time backtracking.
Imagine setting up your own marketing metrics “dashboard” that allows you to quickly see a snapshot of your farm sales. This dashboard would function as the GPS for your business, guiding your next steps and predicting future outcomes. What dials and levers would be included on this dashboard? A quick Google search of marketing metrics turns up phrases like “conversion rate, CAC, EPL, cost per lead, churn rate, and AOV.”
It’s easy to get overwhelmed by the acronyms and sheer number of different metrics you could be tracking. But which ones really move the needle? How do you interpret them? How do we connect the dots into a helpful picture to guide our decision-making?
I’m going to make the case that there are only three key metrics on your dashboard you need to focus on that will drive revenue. These three numbers are the ones that trigger an ‘engine light warning’ if they aren’t moving in the right direction. Let me be clear: I’m not saying other metrics don’t matter. I am saying that these are the three mission-critical metrics that act like the GPS for your business. They show you where you are, where you want to go, and how to get there. Better yet, if you know how to leverage them, you can map out a plan that will double your revenue.
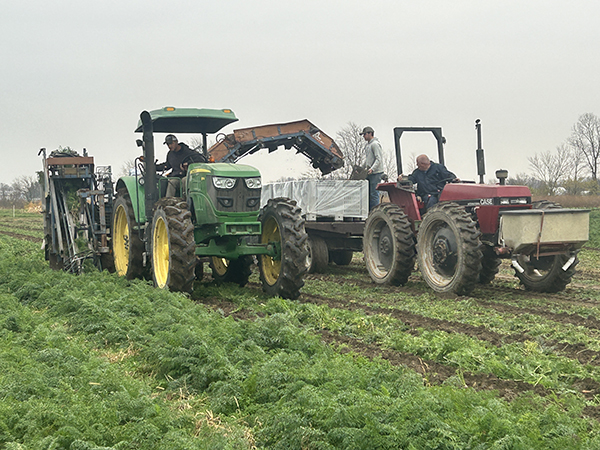
Harvesting carrots on the author’s Shared Legacy Farms in Ohio. All images courtesy of the author.
We’ll break down the three key metrics, how to calculate them, and how to amplify their effect to double your revenue. I’ll show you how to use a powerful calculator tool to reverse engineer your numbers, and I’ll share several common sales strategies to increase each of the metric multipliers so you can ultimately hit your revenue targets.
Keystone metric #1: Total active customers (C)
What is it measuring? Active customers refers to the number of unique individuals who purchase your offer during the specific time period you are measuring. This could be measured weekly, monthly, or quarterly. You could also choose to track this metric by enterprise for comparison (e.g., customers who attended your U-Pick vs. your farmers market).
How to Calculate It: Simply count the total number of unique buyers who have made a purchase during the period you’re measuring. If you use an e-commerce platform to collect sales, you should be able to find this number quickly in your reports. Notice this number is not referring to the sum total of all past customers you’ve ever had (active or inactive). It’s measuring the ones who actively purchased something from you in this period.
When farmers consider growing their revenue, their first thought is often: “I just need to find more customers!” There is some truth to this. The more customers you have, the more sales opportunities and revenue you will create. If 10 people each buy $100 in product at your farm stand, and you want to double your revenue, one way to achieve that is to get 20 people to spend $100 next week.
But most farmers make the mistake of focusing solely on the ‘C’ metric to grow their sales. Anyone in business knows how hard this is to do. Finding new customers is exhausting and expensive. You end up giving your margin away on advertising fees, and new customers often don’t spend very much in their first few transactions. So although “Active Customers” is one of the key drivers of growth, luckily it isn’t the most powerful one. Let’s move on to our second player.
Keystone metric #2: Average order value (AOV)
What is it measuring? Average Order Value (AOV) is the average amount a customer spends per transaction. My AOV can run anywhere between $38/order for my online veggie farm store, to $77 for my Spring Plant Pre-Sale, to $900 for my CSA sales. If you use an e-commerce platform like Local Line, Square, or Shopify to collect sales, you will be able to find this number quickly in your reports.
How to Calculate It: Divide your total revenue by the number of orders. Example: $10,000 revenue/200 orders = $50 AOV.
Here’s a secret: It’s a whole lot easier to get a current customer to spend more, than to find a brand new customer. If your customers currently spend $30 per transaction, then the fastest way to get more money in your pocket is to find a way to get them to spend $40 per transaction.
I can’t stress this enough: your current customer wants to buy more from you! They want to spend their hard-earned money to support a local farmer. Often the biggest stumbling block to growing revenue can be found in our own minds. We’re afraid to ask our customers to buy more.
Basket weaving tomatoes on the author’s farm.
We worry about appearing sales-y, so we don’t make offers. These are limiting beliefs. They simply are not true. I’m here to tell you: If you sell great products, your superfans are eagerly waiting to “collect them all.” Don’t be afraid to entice them to spend more. Getting your current customers to drop a few more items into their carts is one of the best ways to grow your revenue. I’ll share some suggestions for how to incentivize this behavior at the end of the article.
Keystone metric #3: Purchase frequency (F)
What is it measuring? Purchase frequency measures how often your customers buy from you within a given time frame. Loyal customers will buy again and again. Every time a customer returns to purchase, you tap into the well again. Remember: to make more money, you’ll have to make more offers. Many of them will say, no, but a lot of them will also say, yes. Don’t be afraid of the “no.” It’s part of the territory.
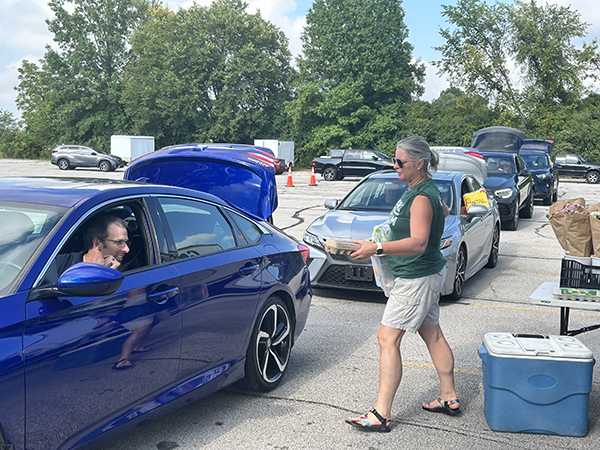
Engage with shoppers at checkout to suggest add-ons, promote weekly specials, and encourage repeat purchases — key strategies for increasing order frequency and boosting revenue. Boost Your Average Order Value (AOV) by encouraging customers to fill their baskets with more of what they love by bundling products, offering upsells, and creating irresistible deals.
How to Calculate It: Divide the total number of orders by the total number of unique customers in that period. Example: 300 orders/100 customers = 3 purchases per customer.
Order frequency is the metric that can truly multiply your revenue. Think about it this way: Every customer has a “lifetime customer value” — the total amount of money a customer will spend with your business over their lifetime. Remember, your customers aren’t just buying once or twice. If you do your job right, they’ll come back more and more frequently for decades.
I have clients who spend close to $2,000/year with me, and they’ve been doing so for 10 years so far. Do the math. Every time you acquire a new customer, you also have the potential to turn them into a lifetime super-buyer. All it takes is pulling the frequency lever.
The multiplying effect: A simple revenue calculator
These are the three metrics that matter most: Active customers, AOV, Order Frequency. I call them the three multipliers because these three powerhouse metrics don’t work in isolation. They work together to amplify your revenue.
Here’s the formula: Revenue = # Customers x AOV x Order Frequency. For example: 100 active customers × $50 AOV x three orders/year = $15,000 revenue.
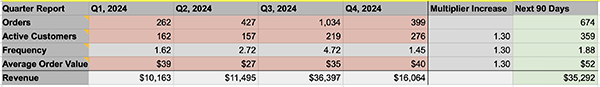
Revenue calculator example: Track your farm’s key metrics – Active Customers (C), Average Order Value (AOV), and Purchase Frequency (F) to project revenue growth. Adjust each multiplier to model different scenarios and set achievable sales goals.
What many farmers don’t realize is that in order to double your revenue, you don’t have to double one of the multipliers. Instead, you just have to raise each of the multipliers by 30 percent. To use the example above, 30 percent for each lever changes the outcome to: 130 customers × $65 AOV × 3.9 orders/year = $32,895 revenue.
I use a spreadsheet to model different financial scenarios for my farm and set targets for the quarter for each multiplier. I then use these targets to drive my marketing decisions throughout the season. I invite you to plug your own numbers into this tool and see how the numbers play out for you. To build the calculator, simply create columns for each quarter of the year. Then create a row for:
- Orders — total number of purchases during the quarter
- Active Customers
- Frequency — enter the formula: orders/customers
- AOV
- Revenue — enter the formula: C x AOV x F
The calculator also includes a multiplier increase column. This projects growth by assuming a 30 percent increase for each metric over the next 90 days. You can play around with the percentage increase number for each multiplier and see what it will do to your revenue. It also helps you reverse-engineer many different ways to get to your revenue target.
Feel free to play around with the multiplier percentage. If a 30 percent increase in customers seems unrealistic, see what happens if you make it 15 percent instead, and then adjust one of the other multipliers a bit higher. Armed with these targets, you now have a roadmap for how to get to your revenue number.
Are you seeing what I’m seeing? This is what it feels like to wake up every day with clarity around what you should be focusing on. If you want to grow your revenue, you must keep your eye fixed like a hawk on these three metrics: C, AOV, and F. Every initiative, every strategy, every protocol must be in service to one of these questions: How is it helping me increase my customer base? How is it helping me increase my average order value? How is it helping me get customers to buy more frequently?
Next steps: Set targets & strategies
Once you have a spreadsheet calculator set up with your data, it will show you what your projected sales goals need to be for Customers, AOV, and Frequency. The next step is to brainstorm strategies and initiatives to make those numbers go up. The rest of this article is devoted to showing you different ways you can do this. Let’s look at the customer multiplier first.
How to increase “C”
To increase the number of active customers, you could try using a referral program. These are effective ways to tap into word-of-mouth marketing. Modern referral programs use software to track referrals made by happy customers through either a referral code, a rewards card, or a referral link. Depending on the referral campaign, customers will usually receive some kind of referral bonus or benefit when they refer a friend. Referral marketing software automates the payout of these referral rewards.
Hosting farm events, tours, or workshops can also draw in new visitors, offering hands-on experiences that create a personal connection to your farm. You could also partner with local businesses or influencers to reach complementary audiences, such as collaborating with florists, bakeries, or restaurants. Try targeting your social media ads to reach new demographics, especially when highlighting seasonal offerings or promotions.
Experiment with creating a new value-added product line that targets a different audience of buyers. One of my farmer friends created a whole new revenue stream by developing a frozen prepared foods line that catered to a new customer base: busy moms and professionals who wanted ready-made healthy food. These are all tactics farms can use to consistently grow their customer base and set the foundation for higher revenue.
How to increase “AOV”
To increase the average order value, you have several tried-and-true methods at your disposal. The first and most obvious one is raising the price. This will often get you to your 30 percent multiplier all by itself. Take a tip from Amazon and try “cross-selling” complementary products like honey, jams, or marinades alongside larger purchases at checkout.
Another common tool to increase AOV is the upsell. This is where you persuade customers to upgrade or purchase a higher-priced version of the product they are considering. For example, if a customer selects a standard bouquet for $25, you could offer a premium bouquet with more stems, specialty blooms, or a decorative vase for $45. Some e-commerce softwares like Shopify include the ability to set up automated “one-click upsell offers.” Otherwise, train your team to have a handful of items ready to suggest at checkout, priced to get you to that 30 percent increase.
Offering volume discounts or bundles encourages customers to spend more by rewarding larger orders with savings. Premium bundles — such as a grass-fed meat producer offering a ‘Grill Master Bundle’ with steaks, sausages, and burger patties — can create perceived value and justify higher prices. You can also play with the product’s portion size. Try offering summer squash as a three-pack, or increase your salad greens from 8 oz. to 12 oz.
I got my online store’s AOV to jump by over $15 last season with another classic strategy: requiring a minimum order value. Now customers are required to spend at least $25 or they can’t check out. Be sure you warn your customers a few weeks before you implement this, and explain why you’re doing it.
Another effective approach is implementing free shipping thresholds, motivating customers to add more items to their carts to qualify. In fact, offering any kind of bonus incentive or free gift will have this effect. “Buy 2, get 1 free” is a common promo formula, because it works. One week I offered a free pint of blackberries with a purchase of $50. In fact, it was the only way to get a pint of blackberries. Guess what? We saw a lot more $50 orders that week. By combining these AOV-growth strategies, your farm can maximize the value of each transaction and significantly impact overall revenue.
How to increase “F”
When it comes to raising order frequency, here are a few tricks of the trade. Try emailing your farmers market customers early in the week to get them to pre-order your product online for pickup at the market. Then, when they arrive to claim their pre-bagged order, have another offer ready. You’ll discover that many of them will buy a couple more items at pickup, and you will have doubled your order frequency.
Another effective approach to increase order frequency involves coaching your customers to create new consumption habits. This may mean suggesting ideas for weekly meal traditions around your products. Themes like Taco Tuesday, Meatless Monday, Soup Sunday, or Grill Night Friday can encourage customers to build their meal planning around your offerings. By promoting these ideas in your marketing, you make it easier for customers to visualize how your products fit into their routine. This not only builds demand but also helps establish repeat buying patterns that drive consistent revenue.
Reward programs are another great frequency bump strategy. Offering a free product after achieving multiple purchases can incentivize customers to buy more often. Try using a physical punch card, or send new customers a special one-time coupon code via email or SMS to be redeemed on their next purchase within seven days.
Creating a VIP Level like “the $5,000 Club” is another way to achieve this result. Customers like the idea of climbing a ladder to achieve perks and status in your brand. Come up with a dollar level that feels exclusive and create rewards that make them want to keep their status.
Here’s another classic frequency order bump strategy in my toolkit: the delayed product release. I like to release a popular product into my online store midway through the week, after the first rush of customers has already placed their pre-order over the weekend. This drives a lot of extra sales, especially if the product has a high perceived value. I’ll hold something back until Wednesday, then announce I’ve just released a fresh batch of raspberries as a one-day special, and watch additional second orders come flying in.
Special seasonal promotions and/or pre-orders for limited-time products can create urgency and excitement, prompting repeat transactions. Every year, we run a Spring Plant Pre-Sale. Most of our transplants sell out online in the second week of February during our pre-sale. Then in May, when customers arrive to pick up their plants, I have extra new varieties on the Plant Sale Wagon for sale to hit them again.
Try running an affiliate promotion with a complementary business, to earn a commission on every order purchased. Offer subscription services for CSA boxes, flower arrangements, eggs, bacon, or grass-fed meat bundles, essentially turning one-time buyers into repeat customers for their favorite products. By focusing on strategies like these, farms can pull the “frequency lever” and get their revenue to easily jump 30 percent.
Next steps: Set your targets
Now that you know the key metric multipliers, it’s time to put this strategy into action. Start by setting revenue goals for this year. Plug your current numbers into a revenue calculator and identify targets for each metric. Create a plan to improve each one. Map out some ideas in your monthly promotion calendar. Then track your progress weekly, asking:
- How are we increasing our customer base?
- How are we raising our average order value?
- How are we encouraging repeat purchases?
When you focus like a hawk on these three metrics, you’ll see your revenue—and your confidence—grow.
Corinna Bench runs a 400-member CSA vegetable farm near Toledo, Ohio. She is a thought leader in farm marketing and is the host of the popular My Digital Farmer Podcast. Join her monthly online membership Farm Marketing School at www.mydigitalfarmer.com/fms.
Copyright Growing For Market Magazine.
All rights reserved. No portion of this article may be copied
in any manner for use other than by the subscriber without
permission from the publisher.