


Excerpt from Flower Farming for Profit
The following is an excerpt from Lennie Larkin’s new book Flower Farming for Profit (Chelsea Green Publishing January 2024) and is printed with permission from the publisher.
For newer farmers, it’s helpful to think of the crop planning process through the lens of sales and marketing (how much of a crop can you sell) rather than flower yields (how many bunches can you grow). While both methods have their merits, I recommend the former for one main reason: It’s easier to grow flowers than it is to sell them. More specifically, it’s easier to grow them than it is to continuously market and sell them at profitable price points on a dedicated schedule over the long term. Anyone can sell a few orders of flowers, just like anyone can do most anything once or twice. But sustaining the process over the long term is what we’re after.
I find that sales projections are much more likely to come true than yield projections. We tend to be more reserved when creating financial projections but wildly optimistic (or even delusional) when it comes to predicting crop yields. Moreover, Mother Nature tends to throw our best-laid plans out the window more often than not for specific crops, but after gaining some experience in sales and marketing, we can learn how to exert more control over our larger financial picture.
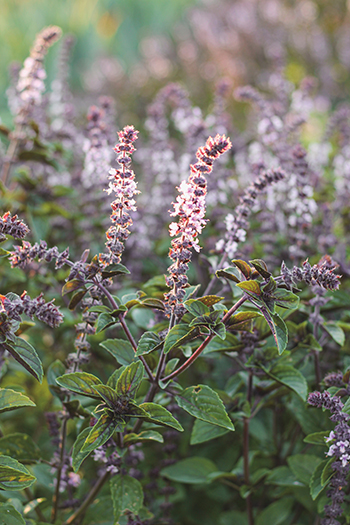 Flowering sage is a great foliage for wedding designs.
Let’s spend a moment looking through a cut flower yield projection in order to understand its limits and why I ultimately discourage this approach for new farmers. Table 6.2 shows a reasonable yield range from one bed of dahlias, along with a few different conceivable price points (based off of my average wholesale and retail price points in California). One dahlia plant might yield anywhere from 5 to 12 sellable stems (this depends on your microclimate as well as any other number of factors). Multiplied out across 133 plants in any of my 300-square-foot beds, total sales might be anywhere from $998 to $4,788. This range is too wide to be very helpful, even if you narrow down the range of stems per plant to fit your microclimate.
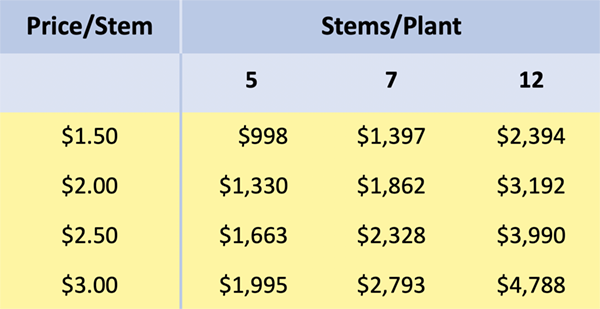 Table 6.2. Dahlia Sales Projections Based on Yield per 300 sq ft Bed (133 plants)
This table doesn’t even factor in the possibility of larger events that could—and do—happen and will knock your production out of the “normal” range, such as floods, heat waves, fluctuating markets, and drops in demand. There are so many points when loss can occur between planning a crop and getting it to market. As I’ve been reminded by one of my farming mentors, Tony Gaetz of Bare Mtn Farm, it’s not unreasonable to assume a 20 percent cumulative loss when you factor in the stems you don’t harvest, loss in storage and transportation, and market shrink. Tony has wisely advised me that a good business plan should be based off of the worst case scenario, not the best.
The one caveat is that, for an experienced farm with good historical yield and sales records and a consistent, trustworthy market, such a projection can indeed be a helpful tool because it’s based squarely off of past success. So, once you have your own dedicated sales outlets and you’ve built systems that can substantiate your farm’s operations, it’s worth looking at your business plan from another point of view: figuring out how much you can possibly produce in a given amount of space and then deciding where to sell it. But in the beginning, I recommend starting from the sales and marketing lens and basing your crop plan off your sales potential.
Crop planning in seven steps
Now we’ll move on to what I consider the actual crop planning process. It’s a complex activity that could fill a whole book. Much like in the financial projections process, I’m advocating for a top-down approach that starts with the general and narrows down to the specific (whereas a bottom-up approach might involve beginning with each individual bed of flowers and working backward).
Step 1: Set weekly total sales goals for each channel
To start, we’ll look at all of your main sales outlets and decide on your weekly sales goals for each. Start with your top-line sales target for the year (see “Top-Down Projections in Five Steps,” page 84, for a discussion of determining sales targets). In chapter 5, we used the example of a gross revenue goal of $90,000 over 30 weeks of production, or $3,000 a week. In this process, we’ll move forward to divide that target among your sales channels and then divide those sales among your crops.
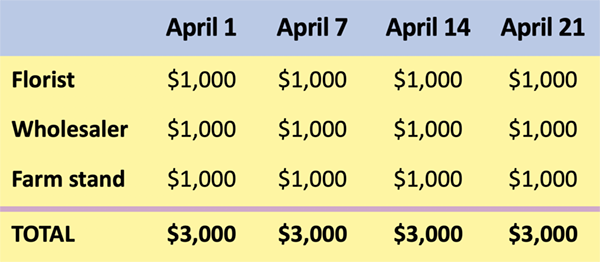 Table 6.3. Weekly Sales by Customer.
Table 6.3 shows a quick and dirty way to set weekly sales goals for each target. First, put your total weekly sales projection at the bottom of each week’s column. Then, divide this total among your customer types. (Refer to table 5.4 on page 87 to think through how much you aim to sell to each customer.) You may have a commitment from your florist customers that they’ll buy a combined $1,000 a week, or records that show your farm stand is likely to sell $1,000 a week. In my example, I split $3,000 in total weekly sales evenly among each of three channels.
Step 2: Choose your crop list
Using your research about individual cut flower crops, it’s time to decide which of them will earn their place on your farm this season. You’ve identified your target customer channels and the general capacity of your farm’s operation; now you can identify which crops will best serve both. It can be overwhelming with so many great cut flower crops out there, but when narrowing your list, remember that there’s never going to be one right answer, so just make your choices and move on. You get to do it again next year.
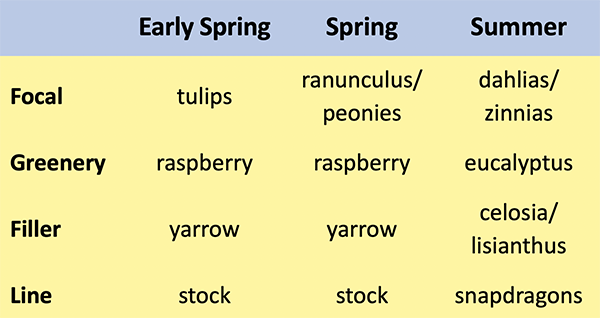
Table 6.4. B-Side’s 2022 Crop List.
A sound strategy for a full-time farm business can be to sell as few as five or ten primary crops at any one time. This might mean that you focus on three main spring crops and three main summer crops, with a few extras scattered in. This small number may shock the dreamers who imagine a field with every color of the rainbow and who have dog-eared every page of their seed catalogs, but most farms that start with too wide a crop list actually excel at only a few of them. For most farmers just starting out, keeping a slim list requires a lot of self-control. You can first brainstorm all the crops you would love to grow, and, after reviewing it, narrow it down to the top crops you suspect you can both sell to your target customers and produce well on your farm.
B-Side’s 2022 crop plan included the 12 varieties in table 6.4. I planned to sell mostly retail through the farm stand (where I focused on bouquets with as few as 3 or 4 ingredients each) and in limited quantities to florists. (For additional information about the crops in B-Side’s bouquet program, see appendix 1.)
As you gain comfort with the crops on your list over the seasons, you can add a few more every season if the demand and wherewithal are there. Finally, as your farm matures, it’s critical that you reevaluate each crop through a lens of profitability, which we’ll discuss in chapter 8. But when you’re just getting started, you often don’t have enough information to do this.
Most of the farmers I work with who are in the second, third, or fourth year of business react with absolute joy when I insist that they can often cut their crop list by 20 to 30 percent and will immediately have a more focused and efficient farm season. No matter where you are in the journey, aim to simplify. I say this in the context of my deep familiarity of the trend among new farmers in our industry to try to grow everything.
Step 3: Create a monthly availability chart
For each crop on your intended list, the next step is to sketch out the longest reasonable season the crop could be in bloom on your farm. This can double as a chart you share with prospective customers to let them know what you’ll be offering this season. Table 6.5 shows what I expect to be blooming on my farm during every month of my growing season.
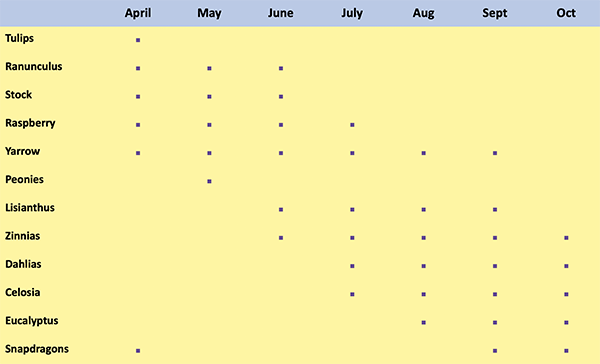 Table 6.5. B-Side’s Monthly Availability Chart.
If you don’t yet have your own records, there are two good ways of getting some of this information. The first would be to “hit the books.” Based on information from seed companies such as Johnny’s Selected Seeds and by finding your area’s average frost dates and days to maturity (DTM) listed online, you can get a sense of when each planting and succession will start blooming. Then you can estimate how long you’ll be cutting off of each plant. It’s this last part that is the trickiest to figure out, but the task is easier if you keep your own records over the seasons (see chapter 12 for more information on recordkeeping).
The second option for gathering this information is to look at the farms and gardens around you, both in person and on social media. When was the first foxglove blooming in the spring or the last dahlia in the fall? Note that in this step, I don’t recommend going deep into your sowing schedule or planning the numbers of successions you’d need to achieve the seasonal harvest.
Step 4: Create weekly “crop plan by sales channel” charts
Once you know the rough monthly availability window for each crop, you can create a more detailed weekly chart for each of your sales channels, as shown in table 6.6. (So, I would make one template each for florist, wholesaler, and farm stand sales.) Start by listing each week (as a date or a week number) across the top and the crops on your list down the left-hand side. Add two more rows at the bottom: one where you’ll plug in your total weekly sales goal (total calculated projection) for that channel (from step 1) and one where you’ll calculate your weekly projected sales of all the crops in bloom that week (total weekly sales goal—you can add a formula to the applicable cells if you’re working in Excel).
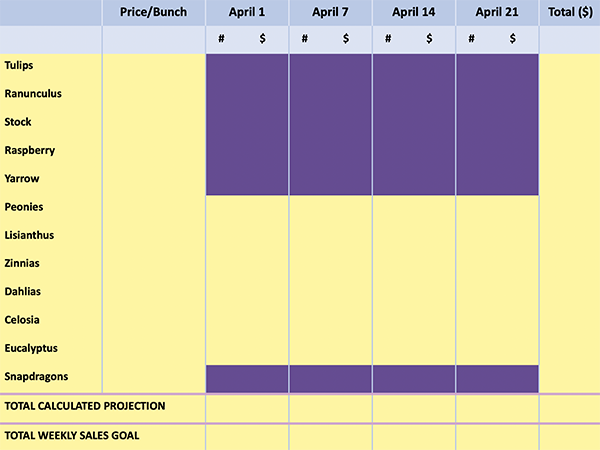 Table 6.6. B-Side’s Crop Plan by Sales Channel Template.
I then go through a process similar to that of the monthly availability chart, highlighting the weeks in which I hope to have each crop blooming (shown here in purple). I split each week into two narrow columns, one for bunch price and one for number of bunches.
Step 5: Allocate weekly sales goals to individual crops
In this step, you’ll determine which crops will get you to your weekly sales goal: divide the goal number among the crops in bloom during each week of the template. Which of your crops, and in what amounts, will lead you to this sales goal? If you’re at a loss for how to project each crop’s individual sales, you can just split the crops evenly the first time around.
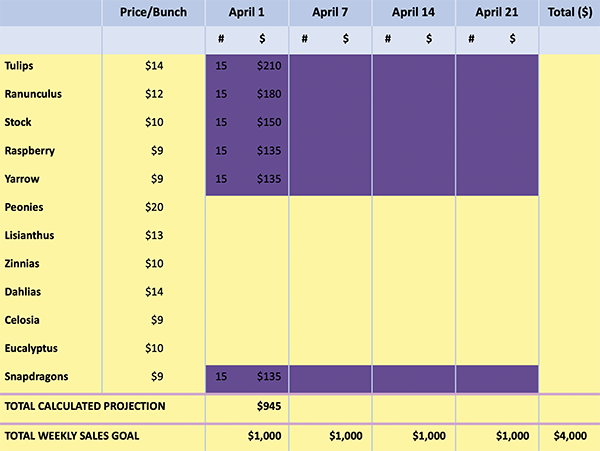 Table 6.7. B-Side’s Crop Plan by Sales Channel: Florists.
Let’s walk through an example with table 6.7, which is the template from the previous step filled out specifically for florist sales. In step 1, I determined that I would aim for $1,000 a week in sales to florists. Therefore, I’ve plugged that number into the Total Weekly Sales Goal row for each week in the table. I’ve also entered the average price per bunch of each crop into the appropriate column.
Next, determine how many bunches of each crop you expect to sell in each week. In this example, I’ve decided to split sales evenly across the crops available during the week of April 1st. This is assuming that my florist customers will take an equal amount of each crop. I need to bring in $1,000 in florist sales by selling the crops in bloom that week: tulips, ranunculus, peonies, raspberry, snapdragons, and stock. Using the average price for each bunch, I played with the bunch numbers until I reached a total close to $1,000—in this case, $945.
At this step in the process, you can see how many bunches of each crop you’ll need each week for each channel, and then adjust your numbers from the top down if something seems off.
Finding the right amount of a crop to provide is difficult before you have specific customers and knowledge of how much they’ll buy. Even as you get more experienced, you’ll go through years of underproducing a crop one year only to overcompensate the next. The goal of the crop plan is to minimize the uncertainty.
Step 6: Determine weekly total for each crop
Next, you’ll add up the weekly sales projections from all of your charts (across all channels) to come up with the amount of each crop you’ll need each week, total. For example, we found that for the week of April 1st, I’d aim to harvest and sell 15 bunches of tulips designated for florist sales. I’d then add this to the number of bunches I’d calculated for wholesale and farm stand sales to come up with the total number of tulip bunches I’d need for the week of April 1st. This will help you get to the next step, which is working backward to figure out how many beds of each crop you need to plant to achieve these numbers.
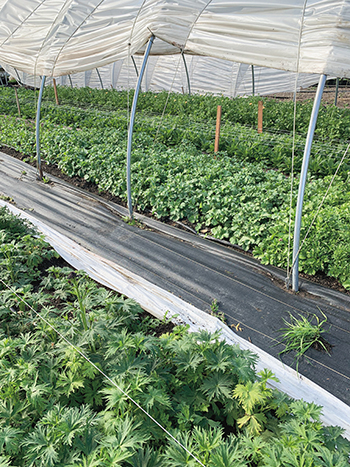 A series of 14’ by 100’ hoophouses for B-Side’s ranunculus production.
Step 7: Calculate bed space needed for each crop
It’s time to venture into the territory with perhaps the scarcest resources in the cut flower world: yield information. There’s not a whole lot of data out there for flower farmers, and predicting yields is difficult for a number of reasons. There are two different options for finding the number of plants needed to achieve specific sales goals.
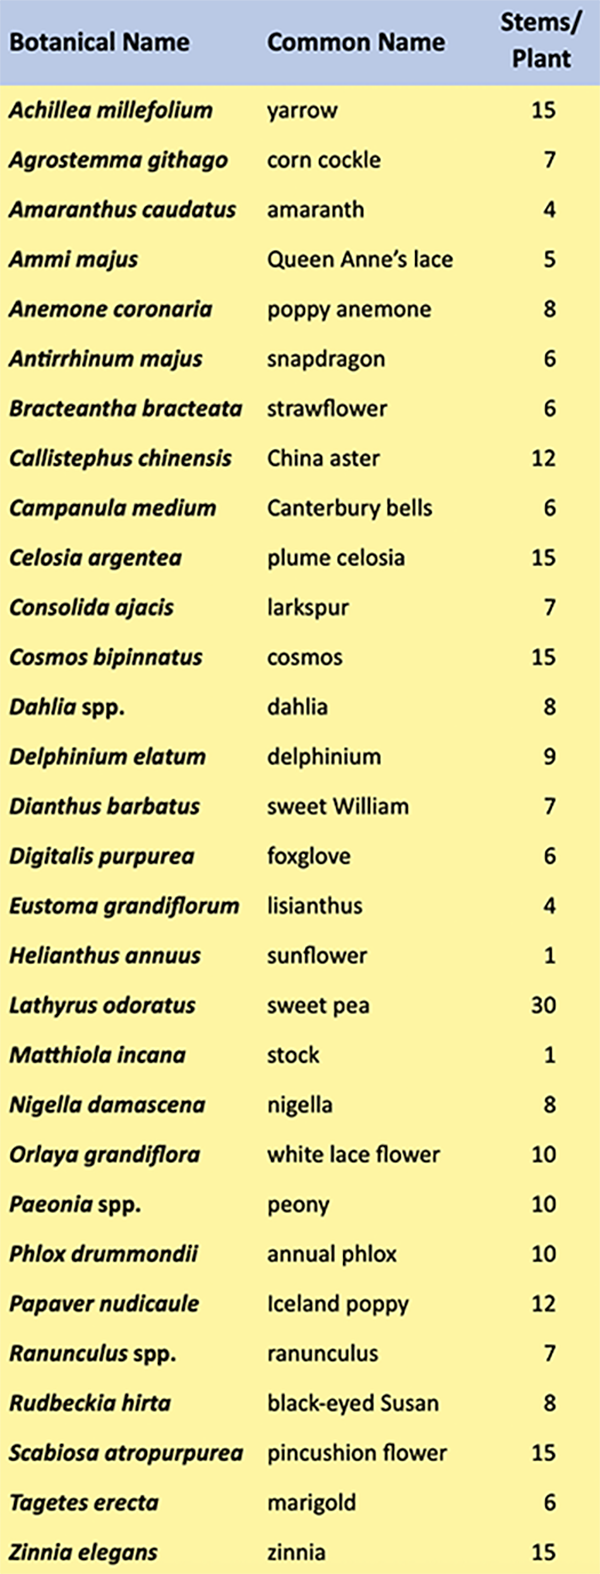 Table 6.8. Crop yield estimates.
The first is to use a simple estimate of how many stems you might be able to cut from any plant each week. To err on the conservative side, you can assume a salable harvest of just one or two stems per week per plant, depending on the crop, and then estimate the number of weeks you expect it to be blooming in your climate. This works well for some crops, such as dahlias. Over the aggregate, most growers will tell you that by the end of the season, they’ve cut and sold about one stem per plant per week of their growing season. While this estimate doesn’t apply to all crops, it’s a start, and it’s the simplest method out there.
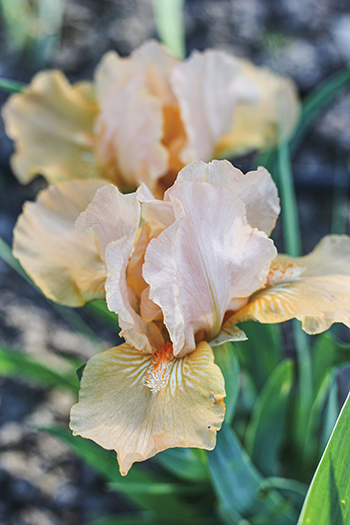 Bearded iris is a great perennial for specialty spring and summer sales
The second option is to dig into each crop independently and estimate how many salable stems each plant will produce over its lifespan; then divide that by the weeks you expect it to bloom. This is a huge data gap in the industry. We all need to get better at tracking and then sharing our own yield data, no matter how different one farm or season might be from the next. As a start, I’ve compiled table 6.8 based on anecdotal averages of stem yields per plant per season from my farm and others. To add to this growing data set, please visit the resources page of www.flowerfarmingforprofit.com.
Using the total bunch numbers for each crop from step 6, I calculate approximately how many beds I need based on my best attempt at yield information. If I expect ranunculus to yield 7 stems per plant over the course of the season, and I calculate that I need 70 bunches (700 stems) to meet my spring sales, I know that I need 100 plants. To be on the safe side, I add 20 percent to my estimated number of plants and grow 120 plants.
I then calculate how much bed space I need based on spacing information from my own notes or from resources such as Johnny’s Selected Seeds or the new Floret Plant Library (https://library.floretflowers.com).
This excerpt is from Lennie Larkin’s new book, Flower Farming For Profit- The Complete Guide to Growing a Successful Cut Flower Business. Lennie is the owner of B-Side Farm, originally in Sonoma County, California, now outside of Portland, Oregon. Flower Farming For Profit is available from Growing for Market. As always, magazine subscribers get 20% off all books at growingformarket.com/.
Copyright Growing For Market Magazine.
All rights reserved. No portion of this article may be copied
in any manner for use other than by the subscriber without
permission from the publisher.