One of the most powerful and versatile tools on many farms is the computer spreadsheet. A basic spreadsheet application like the ubiquitous Microsoft Excel can function as a calculator, database, analytical tool, planning tool, and even as a very editable piece of graph paper for making maps in time and space. I’ve been using these spreadsheet maps for a decade in planning complex crop placements within fields, working out crop rotations, passing on instructions to field crews, keeping dense and compact crop records, and as a cheat sheet in creating weekly and daily to-do lists during the season.
If you have a computer but no spreadsheet application I highly recommend downloading from the internet one of the free open source suites available. Years ago when I wasn’t able to afford a copy of Microsoft Office, I started using OpenOffice (available at openoffice.org) on a PC. When I moved to a Mac I switched over to NeoOffice (available at neooffice.org) which is a little more Mac-friendly. Both OpenOffice and NeoOffice are full office suites including word processing, spreadsheet, databases, drawing and presentation software. They look and feel similar to Microsoft’s Office. They are both completely compatible with Microsoft files, able to open and save files in the Microsoft format, but they do have some differences.
Time and space?
Most field maps that I see are maps of space showing the outlines of the fields, sometimes with the important dimensions and any relevant features noted. I do keep a copy of a map like this to use occasionally, but the map I use the most is one that includes a time axis. My maps are more like a graph with the x-axis representing time and the y-axis representing the location within a field.
One of these maps is easily made on a piece of graph paper. First I make a header row (orient the paper with the long edge on top). For my header row I put a Monday date in each of the boxes along the top of the graph paper. Of course you’ll need a piece of paper with at least 52 boxes across the top to make this work as there are 52 Mondays in a year. The first row below this represents the first bed in a field, the second represents the next bed, and so on.
I also use this system in gardens, although many times garden beds are not very homogenous, comprising many plantings in a single bed. In this case I might use more rows to represent a single bed. On farms there usually aren’t more than one or two crops planted in any single bed so I just use one row per bed.
Shorthand I’ve developed a shorthand that I use to represent different common events within the bed. This allows me to fit a lot of information into a very small sheet of paper, and to easily and quickly interpret that information years later when I go back to figure out what happened to a particular crop, or bed in a field. All of this information is especially useful in planning future crops. The shorthand I use is for common occurrences that are noted many times, such as: H for harvest, M for mowing, T for tilling, and vertical lines to represent the start and end of a crop.
When I do make additional notes I want to make sure that I’ll understand what I meant many years later and so I write them so that anyone on the farm could understand with relative ease. Time and again I’ve found that if I’m not very clear in my meaning that even weeks later I can’t remember what I meant by incomplete notes.
Starting on the top left and reading across a line you can see the progression of a bed through the season. Starting in the first block I’ll usually make a note of what winter cover crop is planted in the bed, when it was seeded and maybe how it was seeded. If the cover crop is mowed down and tilled in on the first week of May, I’ll write MT (meaning mowed and tilled) in the block that represents the first week of May. When the crop is planted, I make a vertical line at the beginning of the block and write in the name of the variety. Usually the next note is an H the week that the crop is harvested. If the crop is harvested for multiple weeks there are multiple H’s, one for each week the crop is harvested. When the crop is finished and turned in, I make a solid vertical line at the end of the week, or half way through if something else is planted back into that bed that same week.
There are plenty of other notes that could be made, but even just noting the planting week, harvest weeks and finish of the crop using just two lines, the variety name and H’s gives very valuable information for future planning with a minimum of effort and space. In addition to the maps, I also keep separate planting and seeding records, greenhouse records, and harvest records, to name a few. I think it’s important to minimize the notes on the map, as they can confuse more important information. Having said that, I do frequently make other notes when convenient and in places where they won’t interfere with taking future basic notes on the map. With crops where beds are harvested all at once I sometimes note the yield on the bed. Occasionally I’ll note weeks of hand weeding, germination, flowering, or other things I want to remember and use in planning for years. If I need more space to make the notes I use the margins and arrows, or earlier blank spaces, but I leave future blocks empty in case I need to make notes there later.
Why use a spreadsheet?
The maps can be easily made with graph paper, but by using a spreadsheet, and putting a little work into the formatting, you can make something cleaner which optimizes the space on the sheet. In addition, it is easy to create a header row on top with the Monday dates for the year, and a list of the bed numbers on the left side of the sheet. For the bed count on the side I use a simple formula which adds 1 to the number in the cell above. For the Monday date I enter the first Monday date of the year and then use a formula to add 7 to each successive cell which will automatically give the Monday dates for the rest of the year. If you’re unfamiliar with using formulas in spreadsheets don’t be intimidated, they are relatively easy to learn and greatly improve your ability to use the sheets effectively.
When I make my crop plan in the winter, I transfer the plan to the spreadsheet maps, using gray background fill to indicate the weeks I expect the crop to be in the bed. I can easily visualize where everything will be, and when it will be there. Like all planning, this is not necessarily what will actually happen during the season, but is an easy way to see if all of the crops planned for will actually fit into the fields at the times they are scheduled for, without conflicting with preceding or successive crops. It also makes double cropping and cover cropping easier, as blocks with no gray fill are obviously available for plantings. Once these crop plan maps are made, they are also excellent for passing on the planting location to field crews. I’ve found this especially true for unusual plantings, such as ones where blank beds are to be left for future plantings, or where the sequence of varieties is important.
Using the maps in the field
Though I use a computer to create the maps, once they are created in the winter I print them out and take all of my notes on the paper copies for the remainder of the season. I make a book using a three ring binder to keep the maps in. Every crop plan map has a blank map behind it. The blank map is where I keep records of what actually happens and I can compare that to the plan. I can also make notes on the plan if I want to make edits to the plan during the season. Once a week I walk through the fields and record everything that happened in the previous week.
During the following week it is easy to use the maps as a quick reference of what crops are in the fields and what stage they are at, beds that are ready for planting, and ones that need to be prepared. For highly diverse plantings this can make scheduling irrigation, tillage, and harvest much easier, especially if you have to pass on the locations of such operations to field crews. The following winter, during crop planning, all of the previous year’s planting weeks and actual weeks to maturity are easy to recall by looking at the maps.
I would never give up walking through the fields regularly, but not having to walk out into the field to remember exactly how many beds of lettuce need to be watered, or prepared, or turned in for example, saves a lot of time during the course of the season. Having a visual record of where and when crops were in a field makes planning future rotations and planting dates much easier. It’s far easier to edit complex farm planting layouts on paper in the winter than in your head during the season.
Josh Volk writes regularly for GFM about tools and equipment. He farms at the edge of Portland, Oregon, and helps farmers around the country improve their farming systems. He can be found at www.slowhandfarm.com


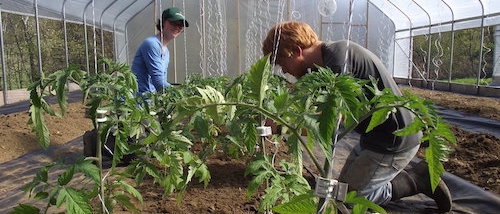
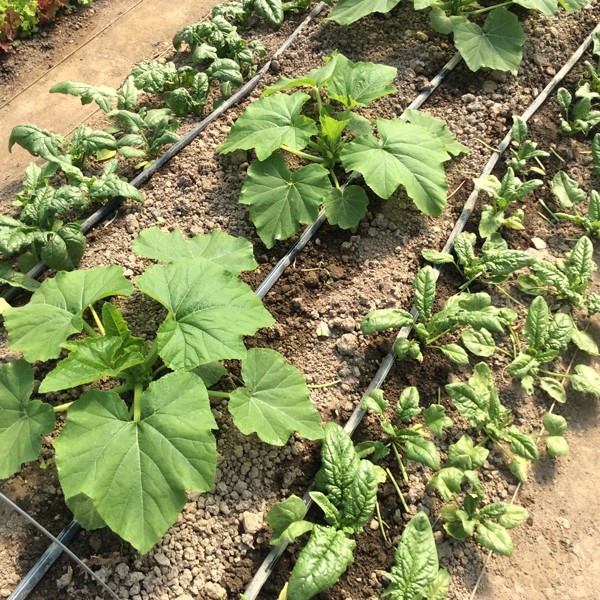 We have three main seasons in our zone 7 central Virginia hoophouse: fall-winter (October to March), spring-early summer (March to July) and high summer (August and September). We grow one bed (90’/27.5 m or so) each of yellow squash and bush cucumbers in the spring-summer season, for reliable early harvests and to help with crop rotation. If you farm in a colder climate than ours, you might be questioning allocating the precious real estate to a crop that so quickly goes from desirable to over-abundant, especially when there are more profitable things to give the space to. One reason is a difference between southern and northern climates.