We are probably the least qualified growers to discuss financial metrics. Over our 40-year career we have always been more interested in farming as a way of life than a business. Our financial goals for the farm have been very modest, earning just enough to cover our minimalist lifestyle and farm improvements.
Other than the most basic bookkeeping to file taxes and track crop sales, number crunching has been limited to sporadic crop comparisons based on gross return or pick-and-pack hours. Additionally, we have participated in several research projects with a financial component.
In 2017, Pasa Sustainable Agriculture invited us to join their Financial Benchmark Study for Diversified Vegetable Farms. We described our first year results in the October 2020 GFM article, “Sobering Financial Benchmarks for Vegetable Farms.” This benchmarking project helped us to see some of the strengths and weaknesses of our operation.
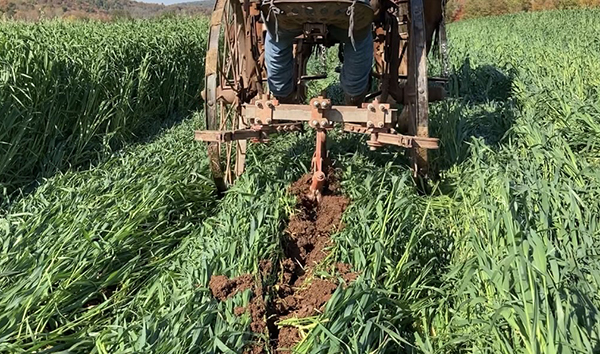
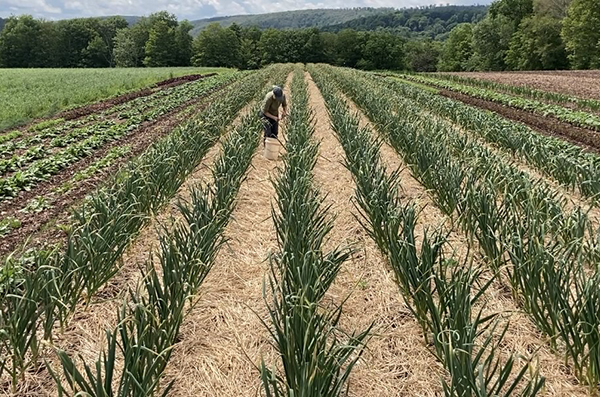
Opening up a furrow in the rolled cover crop of oats to make hand planting the garlic easier. The adjustable cross brackets for the coulter and long shank were made from salvaged cultivator clamps and angle iron.
For example, our net income to gross revenue ratio, a measure of profit potential, has consistently been near the top, at least partly due to not having land, mortgage, or interest payments. On the other hand, our gross income per acre is below the median, likely because we only grow one crop per production year in our unirrigated fields and two crops per year in our high tunnels.
We thought we might gain additional insights by tracking these benchmarks over the years. The Benchmarks for Beech Grove spreadsheet shows that we have been somewhat successful at maintaining our net income goal of $30,000 to $35,000 while slowly cutting back acreage as we head into semi-retirement. The table also suggests that this outcome was mainly due to reducing costs and employee hours. However, these savings came at the expense of increasing our own hours and shrinking our net income/full-time equivalent ratio.

A full-time equivalent is 2,080 hours. So earning $15,597 per full-time equivalent in 2021 came to just $7.50 an hour, Pennsylvania’s miserly minimum wage. To decrease our semi-retirement hours and increase our hourly wage to $15, we decided that we really needed to look into the economics of each of our major crops, beginning with garlic in 2022.
We chose garlic because it is a relatively easy crop to track labor and inputs (e.g., no greenhouse management). Also, garlic has produced consistent yields since we started no-tilling it in 1996, so one year of number crunching should give us a pretty good idea of its profitability.
In addition, David Connor, an economics researcher at Cornell, had put together a complete budget for our 2002 and 2003 garlic as part of the Northeast Organic Network project (www.neon.cornell.edu). His analysis indicated that we were making a small profit at $0.75 /bulb after paying ourselves $10/hour. Now, 20 years later, we were interested to see if the crop was profitable at $15/hour farmer labor and a price increase from $1.50/bulb to $2.00 in 2022.
To provide context for the business metrics we used, here are some of the unique aspects of garlic production on our farm:
We plant our field vegetables, including garlic, in single rows 34 inches apart. Seven 380-foot rows of garlic (just under one-sixth acre) is the right amount for our Saturday market (85 to 95 percent of sales) and a few restaurants. Most of the bulbs weigh over a quarter pound.
We hold back enough of the garlic harvest to plant the next crop. Saving our own seed reduces our costs, but also lowers the amount of garlic we can sell.
Instead of mulching the garlic with imported straw, leaves or compost, we plant the cloves directly into a cover crop of oats, and then bulk up this in-situ mulch with more oat straw grown on either side of the garlic patch. Details of this system can be found in the article, “No-Till Garlic” posted at covercropsincorporated.wordpress.com.
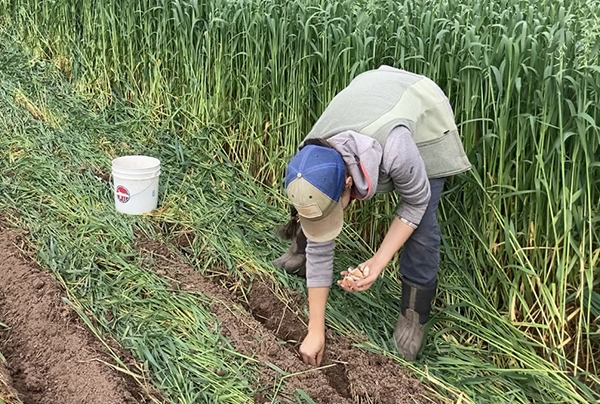 With this method, planting into a cover crop is almost as fast as tilled soil, and enough mulch is grown in place to overwinter the garlic. All photos courtesy of the authors.
To reduce weed pressure for no-till garlic (and all of the vegetables in the market garden), we precede the production year with a fallow year of cover crops and weed-depleting tillage. Maintaining low weed pressure also sometimes requires weeding the soil by hand to prevent weeds from going to seed in the cover crops and vegetables.
The fallow year cover crops, and an application of compost, provide all the fertility for garlic production. This combination also does a good job of conditioning the soil to facilitate no-till planting.
We calculated the materials cost of the horse manure compost by dividing out-of-pocket expenses for bedding and rock minerals by the number of yards of compost produced over the course of the year. Work horse costs were based on purchased hay, grain and minerals, plus routine vet/farrier work, divided by the number of hours we used the team.
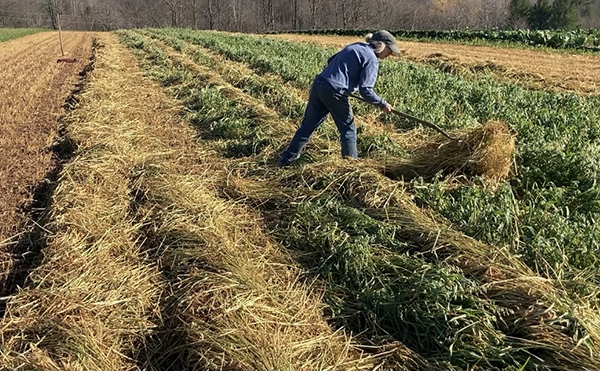 To bulk up the mulch for adequate moisture retention without irrigation, the authors mow the standing oats on either side of the garlic patch and rake it into windrows with a side delivery hay rake. The windrows are moved by hand into the pathways. This system is faster and easier than breaking up straw bales, eliminates the risk of importing weed and grain seed, and the long-stem cover crop straw does not blow away in the wind. Note the short stubble remaining after raking the oat topgrowth. The short cover crop stubble allows the soil to warm up in the spring and facilitates reduced tillage for direct seeding vegetables.
One reason our expenses in 2022 were less than previous years is we trained a teenager to help us on the farm at a starting wage of $10/hour. To make sure the garlic budget would cover the cost of an older, experienced farm employee, we used our 2020 and 2021 part-time hourly wage of $15.
One advantage of slowing down physically is having the time and interest to explore the six different financial metrics for garlic in this article. We hope one or two of them will be helpful for farmers going full speed ahead.
Gross revenue per row
Even for record-keeping luddites like ourselves, this metric was easy to calculate. We simply added up the garlic revenues in our sales invoices and divided this total by the number of rows noted in our field records. Gross revenues per row can be used to compare the productivity of different crops. We can also use it to help realize the gross revenue target for the market garden.
For example, our goal is a gross of $80,000, with $20,000 (25 percent) coming from the moveable high tunnels, and $60,000 (75 percent) from field production. Since downsizing to 100 rows of field production, we need to average $600 per 380-foot row to meet this target. At $1,018/row, garlic exceeds this minimum, offsetting our less productive crops.
Garlic Sales: 225 scapes @ 4/1.00 = $56.00
338 fresh dug bulbs @ 1.50/bulb = $507.00
3,249 cured bulbs @ 2.00/bulb = $6,498.00
65 seconds @ 1.00 = $65.00
Gross Revenue: $7,126
$7,126/7 Rows = $1,018/row
Gross return on pick-and-pack
We learned this rule of thumb in the 80s from longtime market gardener, Mark Dornstreich. At the time, he said a gross return of $20 per hour of harvesting and packing should cover all production and farm costs. How this number was determined, or could be updated for today, is a mystery to us. Perhaps an arbitrary threshold could be set, such as $60/hour, and adjusted upward until farm profitability is achieved.
This benchmark may have more utility for comparing the relative profit potential between different crops on the farm since labor for picking and packing is usually the largest expense of vegetable production. Vegetables with the lowest gross return on pick-and-pack may be ideal candidates for increasing prices, reducing costs or eliminating from the crop mix.
Time trials are often used to determine average, best case or worst case scenarios of pick-and pack hours, depending on the farm’s objectives. We decided to track all of our garlic harvest and market prep hours, including set-up/clean-up time, commute to the fields, etc., to obtain the most complete numbers possible. By this metric, garlic has relatively good profit potential on our farm despite the large number of hours required to clean up the bulbs for market.
Garlic Harvest: 28.25 hours
Prep for Market: 64.5 hours
Total Pick-and-Pack Hours: 92.75
Gross Revenue/Pick-and-Pack Hours = Gross Return on Pick-and-Pack
$7,126/92.75 = $76.83/hour
We need to remind ourselves that the gross return on pick-and-pack only tells us relative profit potential. Earning $77/hour for harvesting and packing garlic does not guarantee that we will cover all of our costs and have anything left over for profit. A gross return of $1,108/row also does not tell us if the crop is actually profitable. For the first step in answering this question, we decided to track the variable costs of our 2022 garlic so we could calculate its contribution margin.

Contribution margin
Josh Volk’s article on the “Tools to help you put the right price on your products” (February 2022 GFM) inspired us to try this metric. The contribution margin tells us how much the crop can contribute to fixed costs, farm reinvestment and profit after covering the variable costs of production.
Calculating the contribution margin for our 2022 garlic was easy. All we had to do was subtract the variable costs from the gross revenue. However, tracking variable costs, both materials and labor, required a substantial amount of record-keeping.
Variable costs are expenses that vary with increases or decreases in production. For example, if we doubled the amount of garlic we planted, we would need to apply twice as much compost. If we stopped growing garlic, no compost would be needed. Therefore, compost, and the labor needed to spread it, would be considered variable costs. Likewise, the cost of mulch, and the time to apply it to the garlic, is a variable expense.
Gross Revenue: $7,126
minus Variable Costs: $2,569
equals Contribution Margin: $4,557
To compare our garlic from year to year, or to other crops in the market garden, it is helpful to add another variable, such as the contribution margin per row or per hour. Crops with a low contribution margin are usually a drag on the profitability of the whole vegetable operation. They should either be dropped or their contribution margin improved by reducing variable costs and/or increasing the price.
$4,557/7 rows = a contribution margin of $651 per row
$4,557/154 variable cost hours = a contribution margin of $29.59 per hour
Josh’s article provides a simple equation to determine the contribution margin for different price points: Simply divide the variable costs by the number of units sold. Then subtract this number from the price. This mathematical shortcut makes it possible to see the effect of different pricing scenarios and/or volumes of sales on the contribution margin without having to recalculate the gross revenue in each case. His formula shows that if we increased the price to $2.50, but only sold 1,500 bulbs, the contribution margin would be almost as low as selling all of the bulbs at $1.50.
Price minus Variable Costs/Units Sold* = Contribution Margin Per Unit
$2.00 - $2,569/3,587 bulbs = $1.28/bulb
$1.50 - $2,569/3,587 bulbs = .78/bulb
$2.50 - $2,569/3,587 bulbs = .79/bulb
Had we followed Josh’s example of tracking the variable costs of all the vegetables grown in the market garden, we would know if the contribution margin of the whole basket of crops was sufficient to cover our fixed expenses. Since we only did the one crop, we needed to put together a complete crop budget to see if garlic carried its share of fixed costs and provided a profit.

Net profit
Calculating net profit necessitates that we know both our variable and fixed costs. Fixed costs include all the expenses that go into running the farm whether or not we grow the crop in question. Most of these fixed expenses we already know from filling out the Federal Income Tax Schedule F Form. They include taxes, repairs, farm and office supplies, utilities, etc.
We went a little overboard by also tracking our fixed labor hours, including the time spent on grass and fence maintenance (for the market garden and horse pasture), work horse care, and our new, labor-intensive method of composting.
Determining net profit also requires that we allocate these fixed costs to a specific crop, which is not at all straightforward. For example, since we started growing our own mulch, no-till garlic requires few supplies, especially compared with a crop started in the greenhouse or grown in our high tunnels. Garlic also takes relatively little time and space for marketing, and it is only available for the latter half of our market season, which runs from mid-May to mid-November.
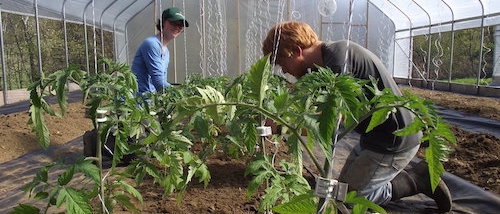
Removing scapes in 2022, the 26th year of no-till garlic at Beech Grove Farm. The two shorter rows on the right are a local strain of Rocambole the authors have been selecting since the 80’s. The taller garlic is German White, which Anne and Eric have been replanting for over 20 years. In both cases, they started with a handful of bulbs.
Richard Wiswall’s Organic Farmer’s Business Handbook shows how to break out and calculate different categories of vegetable production costs to create an accurate and complete crop budget. We opted for simplicity over accuracy, allocating fixed expenses based on a projection of what we thought each row in the market garden should cover. Since we expect field production to generate 75 percent of gross revenue, we decided that each of the 100 rows should carry at least .75 percent of fixed costs (75% x 1% = .75%). Using this simple, if arbitrary method for allocating overhead and fixed labor, the seven rows of garlic need to cover 5.25 percent of fixed expenses.
We used the same formula to set a minimum net income for the seven rows of garlic. Multiplying our market garden goal of $35,000 by 5.25 percent comes to $1,838. Garlic surpassed this threshold, despite the super high veterinary expenses in 2022.
Variable Costs: $2,569
plus Fixed Costs:$2,764
equals Total Costs: $5,333
Gross Revenue: $7,126
minus Total Costs: $5,333
equals Net Profit: $1,793
$1,793/7 rows = $256 net profit/row
$1,793/190 total farmer hours = $9.44 net profit/farmer hour**
Adding $9 net profit to our base pay of $15 provides a total remuneration of $24/hour, not the best in this day and age, but not too shabby considering that a lot of that time is devoted to our work horse way of life.
Net profit margin
Dividing net profit by gross revenue gives us the net profit margin, also called the profitability ratio. This percentage tells us the amount of net profit generated by each dollar in sales. Businesses can be successful operating at very different profitability ratios. However, the prevailing wisdom suggests a profit margin of at least 10 percent to 20 percent is necessary to sustain most enterprises. We suspect that the net/gross ratio for our garlic exceeded this baseline mainly because we did not have depreciation, mortgage, and interest expenses among our fixed costs in 2022.
Net Profit/Gross Revenue = Net Profit Margin
$1,793/$7126 = 25.2%**
25.2% x $2.00 = .50 cents net profit/bulb
Breakeven price
One benefit of going to the trouble of putting together a complete crop budget is being able to determine the minimum price required to cover all expenses. For this measure, we just divide the total costs by the total number of units sold. The math shows that it was a good move to raise the price of cured garlic bulbs from $1.50 to $2.00 in 2022. Otherwise, we would have realized only one penny of net profit per garlic on top of our $15/hour wage.
Total Costs/# of bulbs* = Breakeven Price
$5,333/3587 = $1.49/bulb
All of these metrics suggest that no-till garlic met our minimalist financial goals if we had stayed at $1.50/bulb. With the price increase, it was a profitable crop, increasing our farm net income and the return on our time.
Fortunately, raising the price 50 cents did not reduce demand. If it had decreased sales, then we would need to focus on cutting costs. The big eye opener from doing the complete budget for garlic was realizing that almost 50 percent of our fixed costs were farmer wages. Becoming more efficient with our time for these fixed labor expenses would improve the net profit on garlic at a lower sales volume or price. It would also increase the profit potential for all of our crops while realizing our goal of reducing our hours going into semi-retirement.
For more information about the Pasa Soil Health Benchmark Study, see the 2021 Report “Financial Benchmarks for Direct-Market Vegetable Farms” posted at the Pasa Sustainable Agriculture web site: pasafarming.org. If interested in joining this citizen-science research project, contact Sarah Bay Nawa, [email protected], 814-349-9856.
Anne and Eric have been growing vegetables in Trout Run, Pennsylvania, since 1983. They sell the majority of their certified organic produce at a single farmers market in Williamsport, Pennsylvania.
*Note that using the number of garlic bulbs to calculate the contribution margin and breakeven price lumps in the costs and sales of the garlic scapes and fresh dug bulbs, creating a small amount of error. For instance, the difference between the price of a bulb ($2.00) and the breakeven price ($1.49) is 51 cents while the profit margin shows a net profit per bulb of 50 cents.
**The net profit per farmer hour for garlic is significantly lower than for the whole market garden shown in the Benchmarks for Beech Grove table. This is due to the Pasa benchmarks not including farmer wages or salary in order to make equitable comparisons between farms. The same explanation applies to the differences in the net profit/gross revenue ratios.