


This article was originally published in the April 2021 issue of Growing for Market Magazine.
In 2016, Pasa Sustainable Agriculture (formerly the Pennsylvania Association for Sustainable Agriculture) conducted farmer focus groups and identified aspects of sustainability they would like to monitor on their farms. The top three research priorities were financial viability, soil health and nutrient density, setting in motion several benchmark studies.
We shared our 2017 financial report in the October 2020 issue of GFM. Now, we present results from the 2019 Soil Health Benchmark Study, the third year of the project. Forty-eight diversified vegetable farms participated in the study along with 21 pastured livestock farms and 26 row crop grain operations. Vegetable production ranged in scale from 1 to 800 acres.
Each farm selected three fields representative of their rotation to put under the microscope and keep records of soil amendments, fieldwork, and planting/termination dates for crops and cover crops. Pasa Education Director Dr. Franklin Egan and Research Coordinator Sara Bay Nawa used these records to calculate the soil management indicators shown in Table 1, which compares our fields to all of the vegetable fields in the 2019 study.
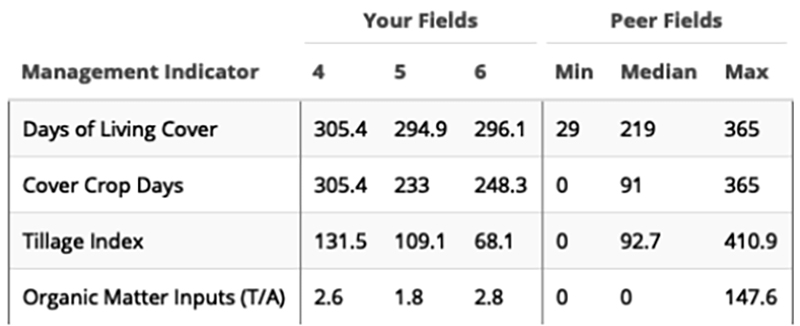
Table 1: Pasa management indicators 2019. This table shows the values for the Nordells’ research fields, compared with the minimum, maximum, and median for peer vegetable farms in the study. For comparative purposes, organic matter inputs have been converted to a dry matter basis. Days of living cover include vegetable crops, living mulches and cover crops, but not weeds or other unplanted vegetation. The days in living cover and the cover crop days are counted from planting until termination by tillage, harvest or winter killing.
On our farm, we precede each vegetable crop with a fallow year of cover crops, except in one of the 13 fields where we grow vegetables two years in a row. In 2019, all three scenarios were represented: Field 4 was fallow with periods of shallow tillage to reduce weed pressure before spring and fall cover crops; Field 5 was the exception and in its second year of vegetable production; and Field 6 was the more typical situation of vegetables following a fallow year of cover cropping.
Although the three fields had a similar number of days of living cover, the tillage index for the bare fallow periods in Field 4 was more than double Field 6, where vegetable beds were prepared with minimum tillage following a winter-killed cover crop and an overwintering cover crop was interseeded in the pathways. The tillage index for Field 5 was intermediate due to incorporating a live cover crop before planting second year vegetables and using light tillage after harvest to establish a winter cover crop.
The tillage index is based on the Soil Tillage Intensity Ratings (STIR) developed by the Natural Resources Conservation Service. The STIR numbers predict the impact of tillage type, depth, area and speed on erosion, rainfall infiltration, organic matter breakdown and carbon loss. The STIR formula does not take into account two aspects of tillage intensity important to many vegetable growers: compaction created by the power source and degradation caused by the RPMs of the implement, such as the pulverizing effect of a rototiller.
These omissions may be one reason why our horse-drawn implements resulted in a tillage index higher than the median of the Pasa vegetable fields. Another reason is that some of our Pasa peers put their vegetable fields into a year or more of pasture or hay, resulting in zero tillage, while others employ hand tools or no-till techniques. Adopting these exemplary practices would probably improve the soil health indicators for our farm shown in Table 2.
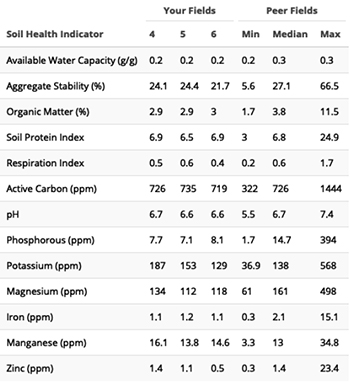
Table 2: Measurements and peer comparisons for the Cornell Soil Health Test Indicators. This table shows measured values for the Nordells’ research fields, compared with the minimum, maximum, and median for peer vegetable farms in the study.
This chart gives the lab results from the Cornell University’s Comprehensive Assessment of Soil Health (CASH) for soil samples collected between mid-October and mid-November. Keep in mind that the numbers may not correspond to the values determined by other labs. For instance, the Cornell lab uses the modified Morgan extraction method, reported in parts per million for nutrient analysis, while many other labs utilize Mehlich 3, reported in pounds per acre. A Penn State soil test for Field 4 in 2018 showed 275 pounds per acre of phosphate (P205) using the Mehlich method, quite a difference from the CASH value of 7.7 ppm phosphorus (P) in 2019. Both labs put our fields in the optimum range for this element.

Another common discrepancy between lab values is organic matter. Although almost all labs today utilize the loss-on-ignition (LOI) method for organic matter testing, Cornell and Penn State correct the LOI result with a mathematical formula which brings the numbers in line with the Walkley-Black wet chemistry test, the standard for many years. As a consequence, the organic matter reading can be a half percent or more lower than private labs that do not apply this correction. Soil test reports for split soil samples from Field 4 sent to Waypoint Analytical, a private lab, and Penn State in September 2018 showed 3.8 percent and 3.2 percent organic matter, respectively. Sampling that October for see CASH gave a reading of 3.4 percent.
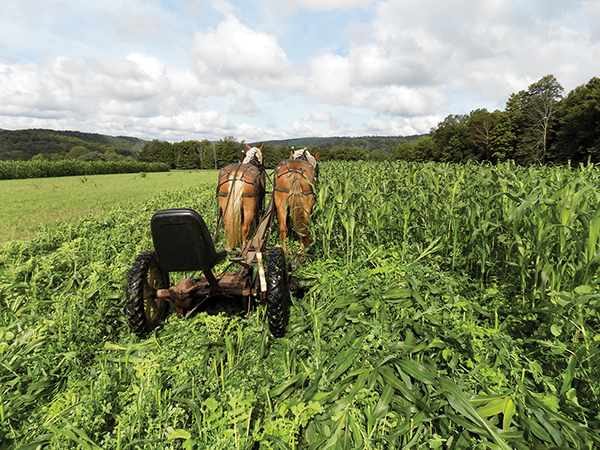 Mowing MaizePro DT, a cover crop cocktail from King’s AgriSeeds (717-687-6224). Note that the sickle bar is elevated 14 inches off the ground to avoid clipping the lower growing cover crops in this eleven-species mix.
Due to the difference in lab numbers for nutrients and organic matter and the lack of familiarity most of us have with the other soil health indicators, the CASH readings shown in Table 3 may provide more meaningful benchmarks. The ratings are based on thousands of test results in the CASH database. Since many of the soil health indicators are influenced by soil texture, soils with similar textural properties are grouped together to level the playing field.
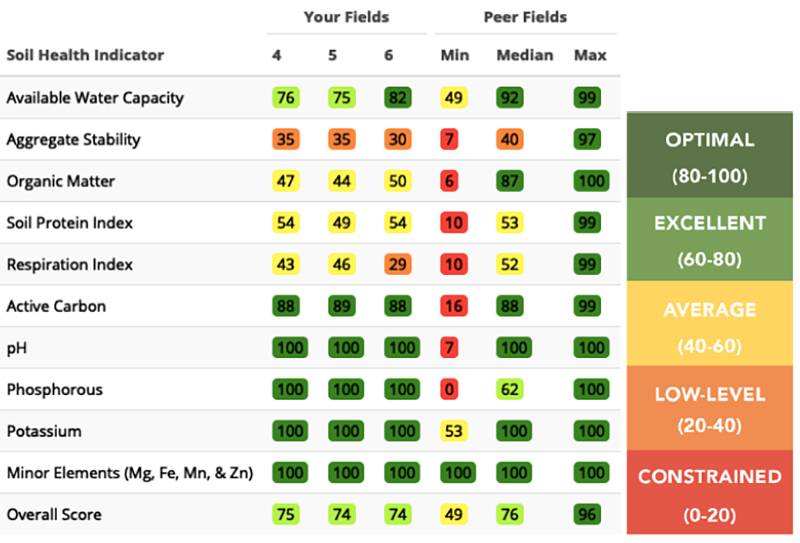 Table 3: Ratings and peer comparisons for the Cornell Soil Health Test Indicators. This table shows ratings for the Nordell’s research fields, compared with the minimum, maximum, and median for peer vegetable farms in the study.
For example, our Field 6 was classified as medium texture due to its composition of 37 percent sand, 38 percent silt and 18 percent clay. With an organic matter value of 3 percent in 2019, this field was right at the median rating of 50 for all of the soil samples with a medium texture. That is, 50 percent of soil samples with medium texture had organic matter higher than 3 percent and 50 percent with lower. For a coarse-textured soil, containing more sand, the median is closer to 2 percent because it is more difficult to build and maintain organic matter in lighter soils. On the other hand, a heavier, fine-textured soil, with a good bit of clay, would need almost 4 percent organic matter to receive a rating of 50.
The median organic matter rating for the Pasa vegetable fields was 87, setting a much higher bar than the CASH database. A surprising revelation in the Pasa benchmark report is that high rates of organic matter inputs are not always necessary to maintain this key soil health indicator at an optimum level. Although some of the vegetable farms with high soil organic matter used eight tons or more of organic inputs in 2019, contrary to expectations, others were maintaining the same level with under two tons per acre, despite, in some cases, a high tillage index.
The soil organic matter rating for our fields was well below the Pasa median even though our farm averaged 2.4 tons per acre of organic inputs in the form of coarse, high-carbon horse manure compost and cover crop straw used for mulching vegetables. We are reluctant to increase our compost application rate for the sake of boosting soil organic matter because our fields are in the sweet spot for phosphorus, neither too high or too low. CASH gives a low rating for a high value of phosphorus due to concerns over water pollution.
Our focus going forward is reducing tillage in the fallow fields and experimenting with diverse cover crop mixes. Advocates of cover crop cocktails claim that at least seven or eight species are necessary to make rapid improvement in organic matter aggregate stability and rainfall infiltration.
Aggregate stability is a measure of how well small soil crumbs hold up to heavy rainfall. According to the Cornell soil health report, these water stable aggregates “prevent crusting, runoff and erosion, and facilitate aeration, infiltration, and water storage, along with improving seed germination and root and microbial health.” We have been able to minimize crusting and erosion with cover crops and shallow tillage, but poor infiltration and runoff remain issues that prevent us from achieving our goal of capturing every drop of rain in our unirrigated vegetable fields
The CASH report provides management suggestions for improving soil health indicators receiving a low or constrained reading. The recommendation for increasing aggregate stability includes using shallow rooted cover crops, adding fresh organic materials, reducing tillage, and rotating with sod crops.
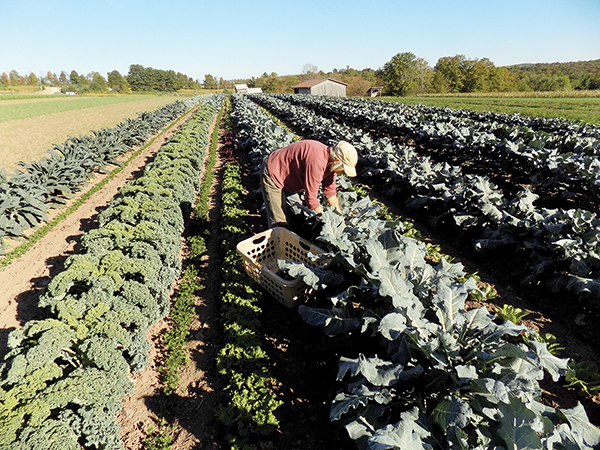 Alternating rows of fall brassicas and lettuce following the MaizePro DT cocktail. Despite the hot, dry conditions in 2020, the crops in this field, interseeded with crimson clover, produced remarkably well without irrigation. The Nordells hope that multi-species cover crops will also improve soil organic matter, aggregate stability, and water infiltration.
To make the biggest gain in water stable aggregates, we should follow the example of our Pasa peers who rotate produce with several years of pasture or hay. However, we are hesitant to use a perennial sod due to past experience with a buildup of wire worms and grubs causing damage to the following vegetable crops. Instead, we are adding Italian ryegrass to some of the cover crop cocktails, hoping the short-term sod will bring up our aggregate stability rating and improve infiltration.
On the plus side, our current system of fallow year cover cropping, augmented with moderate applications of coarse compost, is keeping active carbon in the optimum range. Active carbon is the portion of soil organic matter that serves as food for microbes. Our fields also have a good amount of available water capacity. This measure of how much plant-available moisture the soil can store is particularly important for those of us growing vegetables without irrigation.
Soil respiration is our weakest aspect of soil health after aggregate stability. To improve this indicator of biological activity, we are considering a change in compost-making, to reduce the carbon-to-nitrogen ratio. This move might also increase the soil protein index, a measure of plant available nitrogen. In addition, a more finished, humus-rich compost might improve soil organic matter.
Although we are pleased with the tilth of our soil and the uniform, balanced growth of our crops, participating in this research project has revealed soil health limitations we were not aware of and identified possible causes. We are looking forward to the 2020 Pasa Soil Health Benchmark Report to see if we have made progress and to get the results of the new tests for nutrient density and water infiltration.
For more information about the Pasa Soil Health Benchmark Study, go to pasafarming.org/soil-health. We recommend the case studies exploring solutions to site-specific soil health challenges. Pasa just published a Soil Health Benchmarks 2021 report, which can be found at pasafarming.org/resources.
More details about the CASH soil health indicators, testing methods and scoring system can be found in the excellent training manual on the Cornell Soil Health Lab website (soilhealth.cals.cornell.edu/training-manual/). To purchase a hard copy, contact Aaron Ristow (607-745-7165, ajr229@cornell.edu). Visit the website or call 607-227-6055 for pricing of soil health tests.
Anne and Eric Have been farming in Trout Run, Pennsylvania since 1983. They welcome questions and comments about their soil health and financial benchmark articles at aenordell@gmail.com. A piece about their 2018 Pasa Soil Health Benchmark Report has been posted at covercropsincorporated.wordpress.com.
Copyright Growing For Market Magazine.
All rights reserved. No portion of this article may be copied
in any manner for use other than by the subscriber without
permission from the publisher.