This article originally appeared in the March 2016 issue of Growing for Market Magazine.
Late winter is my favorite phase of the farm business-planning season; my wife and I put the process of reviewing last year’s financial statements behind us, and look forward to the coming year. Memories of the past growing season as it actually went down have faded; we create a vision for the next year that resembles the seed catalogs littering our desks, where weedless rows of perfect crops march toward the horizon in bounteous perfection. I have always felt that this slightly delusional (well, perhaps more than slightly) period of time is actually necessary for renewing our energies and optimism.
New ideas abound. There are new customers we want to work with, new crops we want to trial, old crops we want to stop growing, ideas we’ve had to make ourselves more efficient, and pieces of equipment we want to buy.
The problem, as we make our plans for next year, is prioritizing. Which customers to work with (or not)? Which crops to grow (or not)? Which pieces of equipment to buy (or not)? If we try to do everything all at once, we run risk the risk of diluting our efforts across too many things, to the point where nothing is done efficiently or well. (Believe me, we have done this, more times than I care to admit).
In the past, we resolved these kinds of decisions with some variation of spicy marital conversation. We didn’t have a good business framework for thinking through these questions in a logical manner. That is one of the major reasons I decided to dust off my MBA and offer business planning services to Maine farms: to help us and other growers make good planning decisions.
Recent issues of Growing For Market have covered how to assemble financial statements, and how to review your farm’s current financial state. This article focuses on using last year’s profit and loss statement to forecast the impact(s) of changes you may want to make to your farm business in 2016 and beyond.
Fixed vs. Variable
Before we dive into the nitty gritties of how to do this, I’m going to take you to business school for a few sections. I am going to introduce you to a couple terms and concepts that apply to any kind of business; then we’ll look at how they apply to farms specifically.
Let’s go back to last year’s profit and loss statement (see mine on the next page if you don’t have your own). At the top of the statement are your gross sales, also sometimes called gross revenues or gross income. These represent all the money you collected from all your customers in one year.
Now, it would be great if you could take your gross sales home and spend them on household purchases, or vacation, or whatever you want. Before we get to your net profit at the bottom of the sheet, though, there are a whole bevy of costs that chip away at those revenues. It is crucial, for planning purposes, to divide these costs into two categories: variable and fixed.
Variable costs flex up and down with the scale of your operation. A good rule of thumb for deciding if a cost is variable is to ask yourself, “If I want to grow more [beets, lamb, apples, etc.], would I have I have to buy more of this item?” Variable costs are sometimes also called “Costs of Goods Sold,” or COGS for short (this is the term Quickbooks uses). Common variable costs on vegetable farms include soil fertility, plant propagation supplies, pesticides, seed, and packaging. On livestock farms, feed and bedding are common variable costs.
I generally recommend that farms take a further step, and categorize variable costs into preharvest costs, such as seed and fertilizer, postharvest costs, such as harvest labor and packaging, and marketing costs, such as van fuel and delivery labor. This is because preharvest and postharvest costs behave very differently - preharvest costs tend to rise depending on the level of production - acres planted, animals stocked, etc. Postharvest costs tend to rise based on the quantity of yield - bunches of carrots, pounds of beef, etc. Marketing costs tend to rise based on the number of customers you work with. As we shall see, drawing a distinction between these types of variable costs will dramatically affect how you forecast your revenues and net profits for the coming year.
Fixed costs, on the other hand, do not tend to rise with the level of production; these costs stay the same regardless of how much you grow or don’t grow. Fixed costs are also sometimes called overhead expenses (Quickbooks, strangely enough, calls them simply, “Expenses,” which leads to a great deal of confusion. Many self-taught bookkeepers I know are not aware that you can designate costs as variable “costs of goods sold” in Quickbooks; they lump all types of costs together in the “Expenses” category). Common examples of fixed costs include insurance, certification dues, and lease payments. A very important “noncash” fixed cost is equipment depreciation; in a recent GFM article, Chris Blanchard defined depreciation as, “(Purchase price of equipment - salvage value) / life of equipment.”
The line between variable and fixed costs is a fuzzy and fluid one; some costs may be variable on one farm, fixed on another. Take water, for example. Here in New England, most farms drill a well and pump their own water. The well cost is depreciated; this depreciation is a fixed cost. A farm in the arid west, on the other hand, might buy in water for irrigation at a per gallon price; in this case, water is a variable cost. There is no hard and fast rule for which types of costs are fixed or variable; the best way to determine them for your farm is to use the “If I grow more X, will I have to buy more Y?” test.
Labor costs are typically divided up into several locations. In general, hourly and/or seasonal labor is variable, whereas salaried labor is fixed.
Gross vs. Net
Once the expenses have been divided into variable and fixed, it is time to look at our profits. There are two types of profit to understand and compare: Gross Profit and Net Profit.
First, subtract your variable costs from your gross revenues. This is your Gross Profit. Your gross profit represents all the money you have left to pay your overhead expenses, and hopefully, yourself.
Next, divide your gross profit by your gross sales. This will give you your Gross Margin, which is usually expressed as a percentage figure. Gross margins are one of the most important ratios to look at; they tell you, essentially, how many cents on each dollar of sales can be used to pay overhead and ownership.
Next, subtract your fixed costs from your gross profits - this will give you your Net Profit, which you will still have to pay income taxes on, but at least represents a pretty decent approximation of the money you can use for household expenses, vacation, etc.
Breaking even, meeting profit goals
All of the information I just described can be gleaned from looking at the past year’s profit and loss report. It is now time to use that information to make projections about the upcoming growing season. How many sales do you need to make to be profitable? If you want to earn, say, $40,000 in net income, how much do you need to sell?
The answer to the first question - the level of sales you need to stop losing money and start making it - is called your “breakeven point.” It can be calculated by dividing your fixed costs by your gross margin.
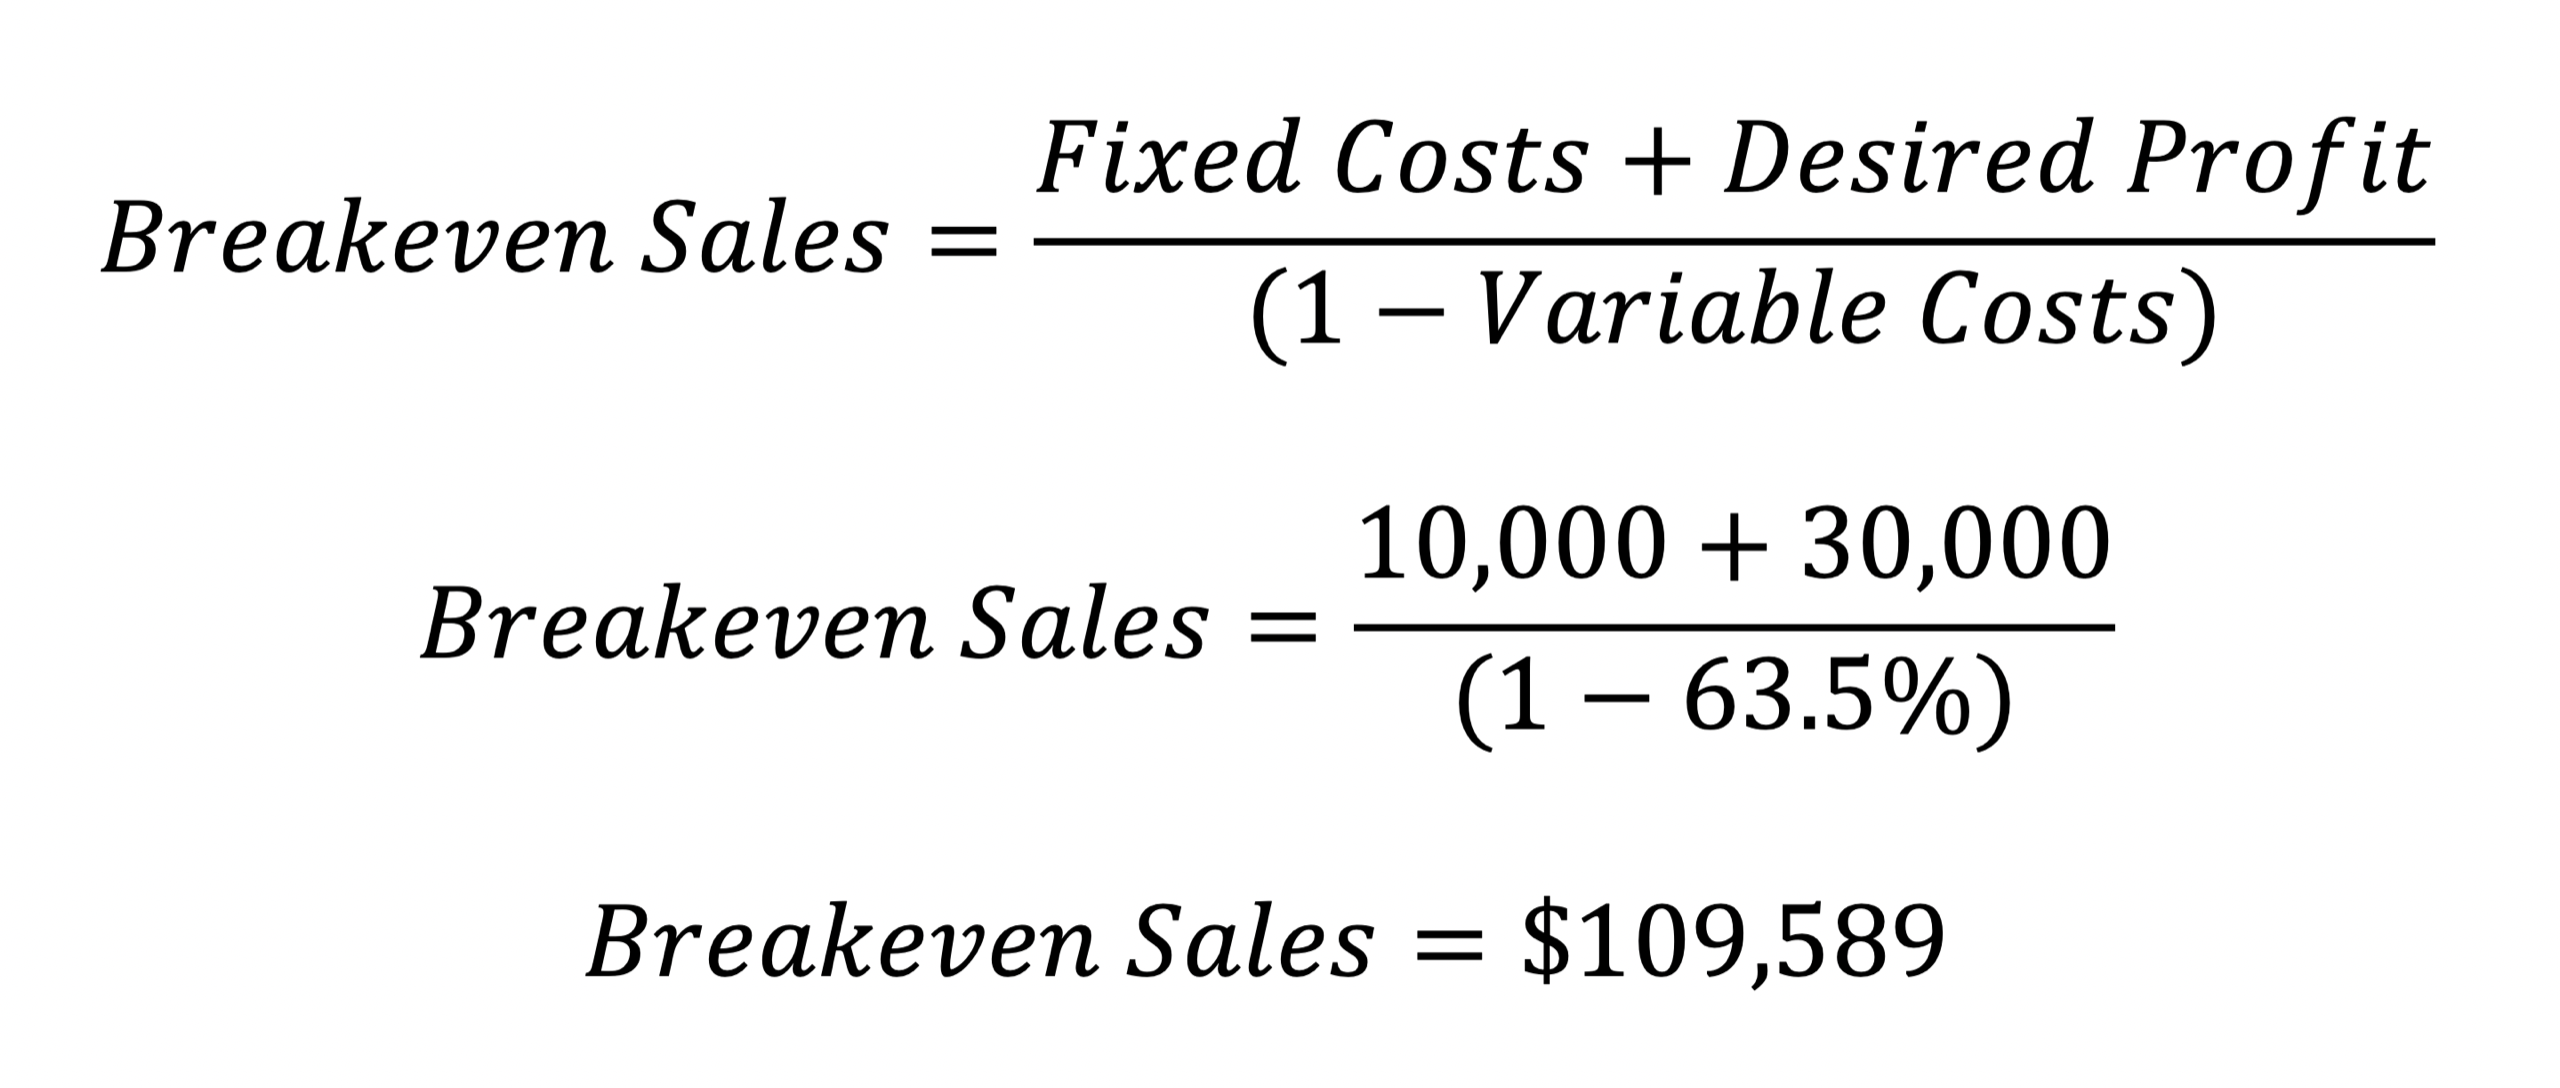
Now, most of us want to do more than breakeven each year - we’d like to make a little money too! To figure out how much you need to gross in sales to meet your profit goals:
Add your fixed costs to your intended profit goal.
Divide this sum by your gross margin.
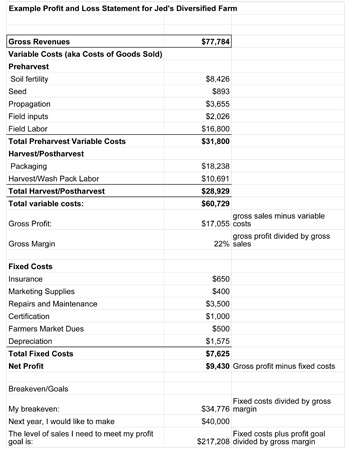
Let’s take an example using the sidebar. Here we have a farm, Jed’s Diversified Farm, who grows 40-50 different vegetable crops a year on about 3.5 acres, and sells mostly to direct markets. My gross sales were $77,784 last year. I spent $60,729 in variable costs last year, for a gross profit of just over $17k, and a gross margin of 22%. This margin is probably lower than I wanted; for a diversified direct market oriented vegetable farm, it should be at least 40%. However, my fixed costs were low; about $7,625. This means my net profit was $9,430. When I divide my $7.6k fixed costs by my gross margin of 22%, I find that I break even at $43,000. This is good, in the sense that I am making a profit. However, I would like to make more than a mere $9.4k for all the work I put into my farm! Say I wanted to make $40,000. I would add this number to my fixed costs to get $47,625, then divide this by my 22% gross margin, to discover that I need to gross just over $217,000 to make $40,000 in net profit.
Two ways to make more money
At first glance, this can seem somewhat depressing. It means I need to almost triple my sales in order to earn what I consider a comfortable living. If I am honest with myself, I know that the chances that this will happen in a year are slight.
However, in making these projections, I am assuming one very important thing: I am simply doing things exactly as I have been doing them, only in greater quantity. I am growing the same 40-50 crops, using the same hand intensive methods; but I am tripling my crew, adding 2 more greenhouses, growing on 10+ acres instead of 3.5. When I start to think about things in those terms, I am starting to get really daunted.
Unfortunately, this case is not as hypothetical as we might want it to be. I often run into farm clients who have attempted to do just this: they have decided to grow their businesses, without significantly changing their operational systems. What they all too often find is that, as they deal with the complications of having more paid help, more infrastructure, and just more of everything, their gross margins start to decline as their sales grow; which means their net profits increase only slightly. In economics-speak, this is called the “law of diminishing returns.” Practically, it means that you are working harder and harder, and getting more and more stressed out, for only slightly more money. For anyone who has lived through this phenomenon, it really stinks.
Fortunately, there are other ways to be more profitable. Generally speaking, if you want to make more money, you have two options:
Do It Bigger - that is, increase your gross sales.
Do It Better - that is, increase your gross margin.
One of the unique features of small to mid-scale farming is that its gross margins are not reliably consistent - that is, the variables of crop selection, markets, farmer knowledge, weather, disease, etc., etc., are so complex that the gross margin of any one farm can be drastically influenced, sometimes by tweaking just a few components of the system. This is not the case with, say, a convenience store, where product prices and gross margins are pretty much dictated to you by your suppliers and your competition.
Investors look at farms this way, and they see risk and unpredictability. As a farm operator, this variability can be used to your advantage. There is almost always a way to do it better without getting bigger. I always try to explore these options with farm clients first, before considering growth.
The rest of this article briefly touches on some of the common ways that a farm can increase its net profits by increasing its gross margins.
Focus on the most profitable crops
For a farm that grows 40-50 crops (or even more than 20), specialization can be a powerful tool to increase profitability. By being more focused you can almost certainly do a better job growing the things you do grow. But how do you decide what to focus on? The flipside of being more specialized is that you are less diversified - and your business is more vulnerable if the things you do decide to grow don’t work out for some reason.
That’s why it’s so important to compare the relative profitability of your crops when making planning decisions. This practice of crop enterprise budgeting, or crop profitability comparison, is a well-known field that warrants an article in its own right. Resources abound; Chris Blanchard covered the topic in the January 2013 edition of this magazine; Richard Wiswall’s The Organic Farmer’s Business Handbook is a great reference.
The short of it is that crop enterprise budgeting allows you to compare the relative profitability of each of your crops, so you can focus on the moneymakers. At a minimum, you’ll be adding up gross revenues and variable costs for each crop; then calculating the gross margin for each crop; this gives you a quick way to compare apples to apples, profit-wise.
Let’s look at the Jed’s Diversified Farm example again - When I run the numbers on my top 18 crops, I discover a wide swing in gross margin from crop to crop - from 60% for basil, all the way down to -113% for cucumbers! No wonder my overall gross margin was so low. If I were to focus on my top 10 crops, my gross margin would jump from 22% to 40%! That means the level of sales I’d need to get to $40,000 net income would drop to $119,000 - much more manageable.
Crop profitability reviews are important, but they don’t tell us the whole story. They tell us which crops might have been more profitable in any given year - but they don’t tell us why. That’s where a crop loss estimate comes in. A crop loss estimate is a financial comparison of your actual sales of a given crop versus your ideal sales. Let’s look at Jed’s Diversified Farm again. I planted 73 beds, and I expected to get 600 heads per bed in an ideal world. At $2/head, I could have grossed $1,200 per bed, or $87,600 total. I recorded sales of only $37,125. That means I “lost” a total of $50,475 in potential sales. When I divide this total loss by the total ideal sales, I get a “crop loss rate” of 58%. My average across all crops is about 49%.
Crop loss estimates help you understand and troubleshoot the deeper issues than span your entire farming system, across all crops. For instance, did I grow great crops, but overestimated my customers’ ability to buy them? Or is there a soil fertility issue that is inhibiting yields of many of my crops? A crop loss estimate can also help explain differences in a single crop’s profitability from planting to planting - for instance, if your carrots were very profitable one year, but not the next, and you planted them in two different fields, the issue might not be that you are not good at growing carrots - it might be that one of the fields might have too many weeds.
Crop loss estimates can hide - they don’t necessarily reflect actual expenses that show up on your books. But they can be very costly. This is because, in farming, you invest in and use most of the inputs you need well before you have a marketable crop to harvest - and for the most part, you make those preharvest investments no matter what the yield is going to be. On the flip side, improving a crop loss rate drastically improves your gross margin. That’s because those same preharvest variable costs generally stay the same as yields improve. For instance, if Jed’s Diversified farm were to cut its loss rate down to 30%, it might see an increase in gross margin to 33%.
Focus on profitable customers
Want to decide whether or not it’s “worth it” to work with a certain customer or market? You can use a similar formula to calculate your breakeven point. Add up all the costs associated with that market on a weekly basis - delivery fuel, labor, farmers market fees, depreciated supplies like tents, tables, etc. - and divide this sum by the average gross margin of the crops you sell at that market. This is the “breakeven point” at which it’s worth it for you to even be in the market. As an example, a farm I work with estimated about $400 per week in market costs. His gross margins on average were 50%. This means he needed at least $800 per week in sales to justify going to the market.
Invest in Equipment
Investing in the right equipment can drastically improve your gross margins by reducing your labor costs - but how do you know if your production justifies the upfront costs and ongoing depreciation? Here’s a basic formula to help guide you:
Estimate the annual fixed costs of the equipment, including depreciation, maintenance costs, etc.
Estimate the change in gross margin that using the equipment would create.
Divide the annual fixed cost by this change in gross margin - that’s the breakeven point of sales you would need to justify the equipment.
Let’s take an example: suppose you were considering purchasing a used walk behind salad mix harvester for $10,000, and you hoped it would last 10 years. There is a fixed cost of $1,000 per year in depreciation. Now, you know your field crew can harvest 10 lbs. per hour by hand, and you pay them $10/hour. It costs you $1/lb. in harvest labor. Assuming you get $10/lb average for your mix, your harvest labor is 10% of your total revenue. Now, assume you can harvest 300 lbs. per hour with the harvester. Your harvest labor cost per pound would drop to $.03. This is nearly a 10% difference in gross margin.
Now, divide the $1,000 annual fixed cost by the 10% difference. You need to sell about $10,000 worth of salad mix annually, or 1,000 lbs., to justify the harvester.
When I run these numbers with farms, I often find the breakeven points are much lower than might be expected; this tells me that many farmers are undercapitalized, especially on harvesting equipment, and that a few smart investments in the right tools for the right crops can dramatically improve gross margins.
Jed Beach is a farm business consultant and organic vegetable farmer in Lincolnville, Maine. He and his wife operate 3 Bug Farm, where they wholesale greens, herbs and other crops to stores and restaurants. Jed provides business planning services and crop profitability assessments to farmers through his practice, FarmSmart. More information can be found at www.farmsmartmaine.com.

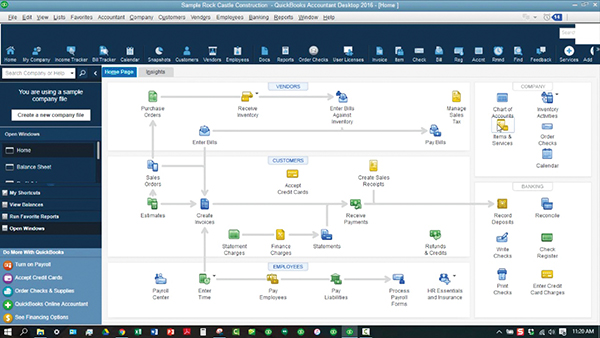 There are a lot of options to consider before picking the best bookkeeping software for your business. One choice a lot of growers have been facing lately is whether to stick with desktop software or move over to the cloud-based software that most developers are switching to.
 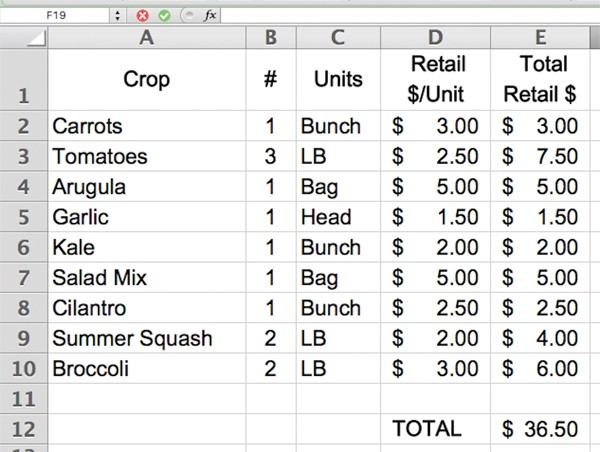 Stop recordkeeping. That’s right, put down your scribbled pencil notes, delete those apps you forget to open and drop that unfinished Excel spreadsheet in the trash. Like most things in life, more is not always better. More recordkeeping cannot lead to more knowledge and better decisions if you have incomplete data or do not turn raw numbers into useable information. It is important to start small, develop good procedures (and habits), and build from there.
  Have you ever ended the season feeling like you rocked it with sales and production, yet still have no cash in the bank? You worked your tail off, but there’s nothing to show for it.
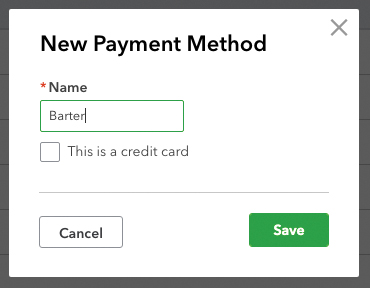 Exchanging goods or services is a common way for farmers to interact with service providers and other farmers. In fact, as a bookkeeping consultant, I often accept payment in the form of pork chops or organic coffee. I know farmers who trade fresh bread for carpentry work and beef for hay mowing. Not all vendors are comfortable with this sort of payment, but when they are, it can add great value to both businesses.
 I’ve been teaching business skills and financial management to farmers for over ten years. When I started out, I was fresh out of business school and teaching college accounting. I was very academic in my approach.


 Hiring your first employee is a rite of passage for many farmers. It’s common for a farm to start with one or two extremely dedicated owners who do all the work. Then as the farm grows, it’s time to bring in some outside help.