By Jed Beach
Fall is finally making inroads to our gardens. Cool gusts of winds are breaking apart the muggy heat that has dominated most of the late summer here in Midcoast Maine. Each gust brings with it the feeling that cold nights, and all-too-soon frost, are just around the corner. The end of the growing season is visible, perhaps distant still, but apparent.
At this time of year, our minds shift from 100% go-go-go mode to a balance of reflection and action. As my wife and I harvest and pack, we mull over the various crops we’ve grown this year, and start to sort them - the winners, the losers, the surprises, the disappointments. What worked? What didn’t? We write down what we can while it’s fresh in our minds. Right now, our opinions are 100% emotionally driven, but in November, we’ll start back in with the spreadsheets and add a dimension of data to our assessments.
Those of you who read my last article in the May 2018 Growing for Market remember that the method we use to evaluate the potential profitability of our crops is to calculate the “unit cost” for each crop - that is, the minimum price we would need to receive in order to pay all of our expenses and ourselves. Calculating unit cost also provides us with the ability to compare the relative profitability of each crop by comparing each crop’s net margin (Net margin = (Price received - unit cost) / price received).
This is especially important for growers who want to break away from dependence on the five typical mainstays of small farm marketing - farmers markets, farmstands, CSA’s, natural foods stores, and fine dining restaurants. These markets tend to be less price sensitive - that is, they tend to absorb increases in price with relatively little effect on volume. But, as these markets become saturated, small growers find themselves looking toward more mainstream markets, such as larger grocery chains or midpriced restaurants.
Often the demand for locally grown crops is there, but these markets tend to more price sensitive - that is, they are less willing to pay much more than the market price they would have to pay from their distributor. In these cases, knowing unit cost is extremely important. If you have to lower your price to access a market, unit cost provides you with the “floor” which you can’t go below.
Calculating unit cost with a high level of accuracy requires a fairly heavy amount of recordkeeping - and, if you’re growing 50-60 different crops, how do you know where to focus your limited recordkeeping time? After having made these somewhat time-intensive calculations for each of our crops, and after having helped other growers make similar calculations in my winter capacity as a business consultant, I’m left wondering if there isn’t a less time and recordkeeping-intensive way to estimate the relative profitability of different crops.
Nothing is as accurate as keeping good records and making thorough enterprise budgets. But after doing this enough, I’ve started to notice that crops with certain characteristics consistently emerge at the top of the profitability list for small, diversified farms. I’ve started to develop a hypothesis: that there are four factors that predict which crops can be competitively profitable for small farms to grow, even at close to distributor prices.
I call this a hypothesis because it is in no way based on any kind of statistically defensible research - it’s based on my own observation working with our farm’s numbers, combined with the experiences of other farms I’ve worked with. My intent is to give farms growing more than 25 crops using mostly hand methods of harvesting a way to quickly winnow down their list of crops that could be profitably expanded, so they can narrow their recordkeeping efforts to a more manageable number of potential candidates.
Here are the four factors and how/why they can be used to gauge the potential profitability of a crop:
Perishability
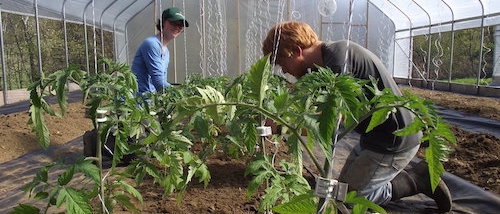
More perishable crops tend to be more profitable for smaller scale growers than less perishable crops. There is a economic reason for this. Imagine a very large scale farm growing, say, 2,000 acres of broccoli. The farm maintains several harvest crews of 15-20 people, who each harvest, pack, and ice thousands of pounds of broccoli per hour using a tractor driven conveyor belt harvest aid. This farm’s unit cost is probably lower than a smaller farm’s might be.
However, as soon as the knife touches the broccoli, it starts to perish. There is now a race to get it to the end consumer before it is unsaleable. In a large scale system, that broccoli has to pass through many hands - for instance, it might go to a light processor to be floreted and bagged, then through a distributor, then through a supermarket warehouse, and finally to the individual store.
For each of these businesses, holding broccoli inventory is risky - it could perish at any time. In order to account for this shrinkage, each component of the supply chain has to mark the price up. These markups accumulate as the broccoli makes its way through the supply chain. By the time the broccoli ends up in the end consumer’s basket or plate, there is a wider spread between the price paid to the farmer and the retail price than there would be for something less perishable.
For example, in the Northeast at the moment, a 2 lb. bag of carrots is selling for $.48 per lb. at the terminal market in Boston (where supermarkets and distributors often buy their produce). That same bag is selling for about $.60 per lb. at the store. The carrots have been marked up about 25%. Green kale, on the other hand, sells for $1 per bunch at the terminal market, but $1.63 retail. The markup is 63%.
For a small farm serving local markets, this provides an economic advantage. Since their supply chain is shorter, they can capture the value that gets lost in shrinkage along a more complicated supply chain. This helps to offset the unit cost disadvantage a smaller farm faces when competing against a larger farm.
The less perishable a crop is, the smaller this advantage gets. I have seen a lot of 4-8 acre farms who have added a lot of storage crop capacity over the last few years. They are usually doing so in order to provide more seasonally even cash flow and workload. However, when we look at the numbers, storage crops tend to be less profitable at this smaller scale, especially when the farm attempts to expand into more mainstream markets. This means that the farm sees only a marginal increase in net profits as it increases its storage crop production.

Matching plantings to sales
Growing more perishable crops can be more profitable for a smaller farm, but only if that farm accurately matches its production to its sales. If a farm plants 3 times more tomatoes than it can sell, then the costs to prepare soil, plant, prune, trellis, etc. will outstrip the profits it can gain from selling only 1/3 of the crop. Of course, underplanting can also be problematic; as a general rule of thumb I shoot to sell at least 80% of the potential yield of a perishable crop. Leaving a 20% buffer ensures we plant enough to avoid shorting our customers on their orders (most of the time).
Gross sales per square foot
Sales per square foot is often used as a first rough gauge of crop profitability. It’s very rough, because square foot sales alone doesn’t account for the crop specific costs required to produce that yield. However, on farms with a limited land base, sales per square foot can be a very important indicator of profitability. On a farm with a small amount of land, each square foot bears a relatively high level of overhead costs (insurance, repairs/maintenance, loan interest, etc.). This overhead “rent” needs to be offset with a relatively high level of sales for every square foot.
Gross per harvest/pack hour
On a diversified farm that harvests and packs mostly by hand, harvesting and packing produce typically consumes 1/2 to 2/3 of the overall labor. Since labor is usually the single largest cost on these farms, and harvest/pack labor is such a large proportion of overall labor cost, the labor required to harvest and pack a crop is also a pretty good indicator of profitability.
For farms that struggle to keep track of labor costs associated with crops, harvest/pack labor is usually the easiest to tackle - add an extra column to your harvest and pack list to note the time it took to harvest and pack each crop (Don’t tell your crew this, but you don’t even need to be 100% consistent in writing this down- a sample of, say 5 different harvests of each crop spread across different parts of the season is usually sufficient).
Putting it all together
Using these four factors, you can make a chart that enables you to quickly estimate the profitability of your crops. In one column list your crops. Then, in the next four columns, rank each crop by perishability, match of planting to sale, sales per square foot, and sales per harvest/pack hour.
For instance, here is a chart we made of some of our most and least profitable crops last winter. I also included the net margin for each crop that comes from our enterprise budgets so we can see the connection between the “four factors” and profitability (see the chart below):
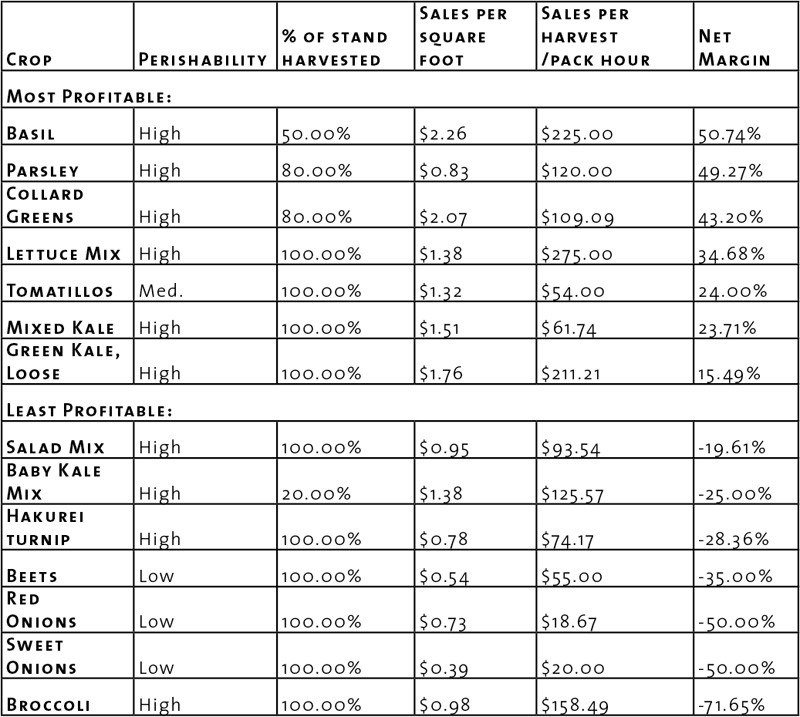
Note that the top four most profitable crops all have very high gross per harvest/pack hour rates (at least $100). On the unprofitable list, three of the crops are storage crops. The others have some strengths, but also some weaknesses. For instance, our direct seeded salad mix is perishable, and well matched to sales, but it yields less per square foot and takes much longer to harvest and pack than its Salanova counterpart. Therefore it appears to be less profitable. Baby Kale mix has strong potential, but we only sold 20% of what we planted - therefore it wasn’t very profitable. Broccoli yields a relatively low amount of sales per square foot, and therefore can’t pay our overhead cost “rent.”
The purpose of this chart is to provide an example of how to use the four factors to estimate profitability. It’s not intended to draw any conclusions about these specific crops on your farm. You may find that some of the crops listed here are actually much more profitable on your farm than ours (or vice versa).
It’s also important to note that, before we decide to drop any of the crops with negative net margins, there are changes we could make that would improve their profitability. For instance, if we sold enough salad mix to justify purchasing a walk behind harvester, that would greatly improve our harvest rate. If we matched our baby kale plantings more accurately to our sales, it might be one of our most profitable crops. And if we were willing to expand our acreage and stretch our overhead costs over a larger amount of square feet, broccoli could be profitable.
Feedback wanted
As a farmer and as a business consultant, I want to see more local foods in more mainstream (and price sensitive) markets. I believe that these four factors may help us focus our energies on the crops that are most likely to be profitable for us as we develop these relationships.
I’d love your help. In a completely informal, non-statistical way, I’d love to hear from you about this “four factors” hypothesis. Does it jibe with your experience assessing your crop profitability, or is it contradictory? Do you have any thoughts or reflections to add? I welcome your feedback in an attempt to prove or disprove this hypothesis. Thank you and I hope you have bounteous fall.
Jed Beach is a farm business consultant and organic vegetable farmer in Lincolnville, Maine. He and his wife operate 3 Bug Farm, where they wholesale greens, herbs and other crops to stores and restaurants. Jed provides business planning services and crop profitability assessments to farmers through his practice, FarmSmart. More information can be found at www.farmsmartmaine.com.


 Since its founding in 1968 by my husband Eliot Coleman, Four Season Farm has sought to produce the best vegetables possible, using soil-based organic methods, on a small amount of land. When I showed up in 1991, Eliot had begun to pioneer winter vegetable production, and I was delighted to give up the landscape design business I’d run in Connecticut and grow veggies with him. Then, about 10 years ago, flowers started to creep in.
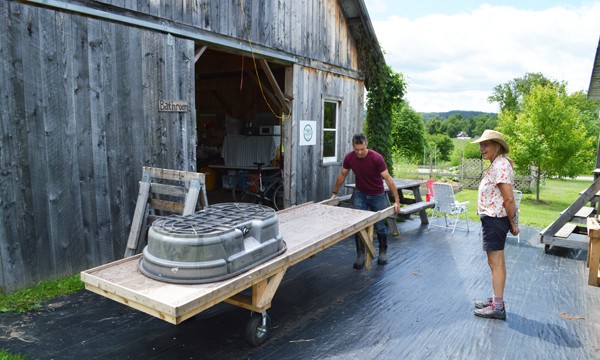
 Exchanging goods or services is a common way for farmers to interact with service providers and other farmers. In fact, as a bookkeeping consultant, I often accept payment in the form of pork chops or organic coffee. I know farmers who trade fresh bread for carpentry work and beef for hay mowing. Not all vendors are comfortable with this sort of payment, but when they are, it can add great value to both businesses.
 I’ve been teaching business skills and financial management to farmers for over ten years. When I started out, I was fresh out of business school and teaching college accounting. I was very academic in my approach.
 Our expectations as farmers are way out of whack. We wear a dozen different hats in a single day: tractor mechanic, HR professional, educator, parent and so many more. Why are we asking ourselves to be our own financial advisors too? The most common message is that, with a bit of focus during the off season, a few tweaks to our daily routine, and a three-hour workshop we will be an expert in QuickBooks and able to set up and run our business’ financial recordkeeping with ease. This is simply not true for most business owners.
 Among successful market farms, there is a trend toward diversification and away from specialization. As growers gain experience, they tend to add new crops and markets and extend their seasons. They find ways to maximize income from everything they grow and put all their land to good use.

 A mile of gravel road crosses the Winooski River over an old covered bridge, leading to Cate Farm. On a beautiful clear bright summer day, the long and lanky Richard Wiswall saunters over to warmly welcome me. Even though it’s a Monday morning in July in Vermont, during what should be the busy season, he’s full of smiles and exudes warmth and ease. Instead of a stressed-out, disheveled grower, there is a composed and relaxed man greeting me.
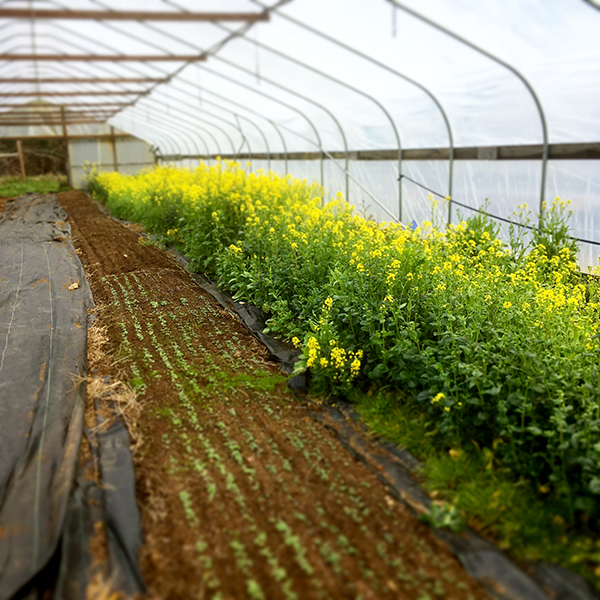
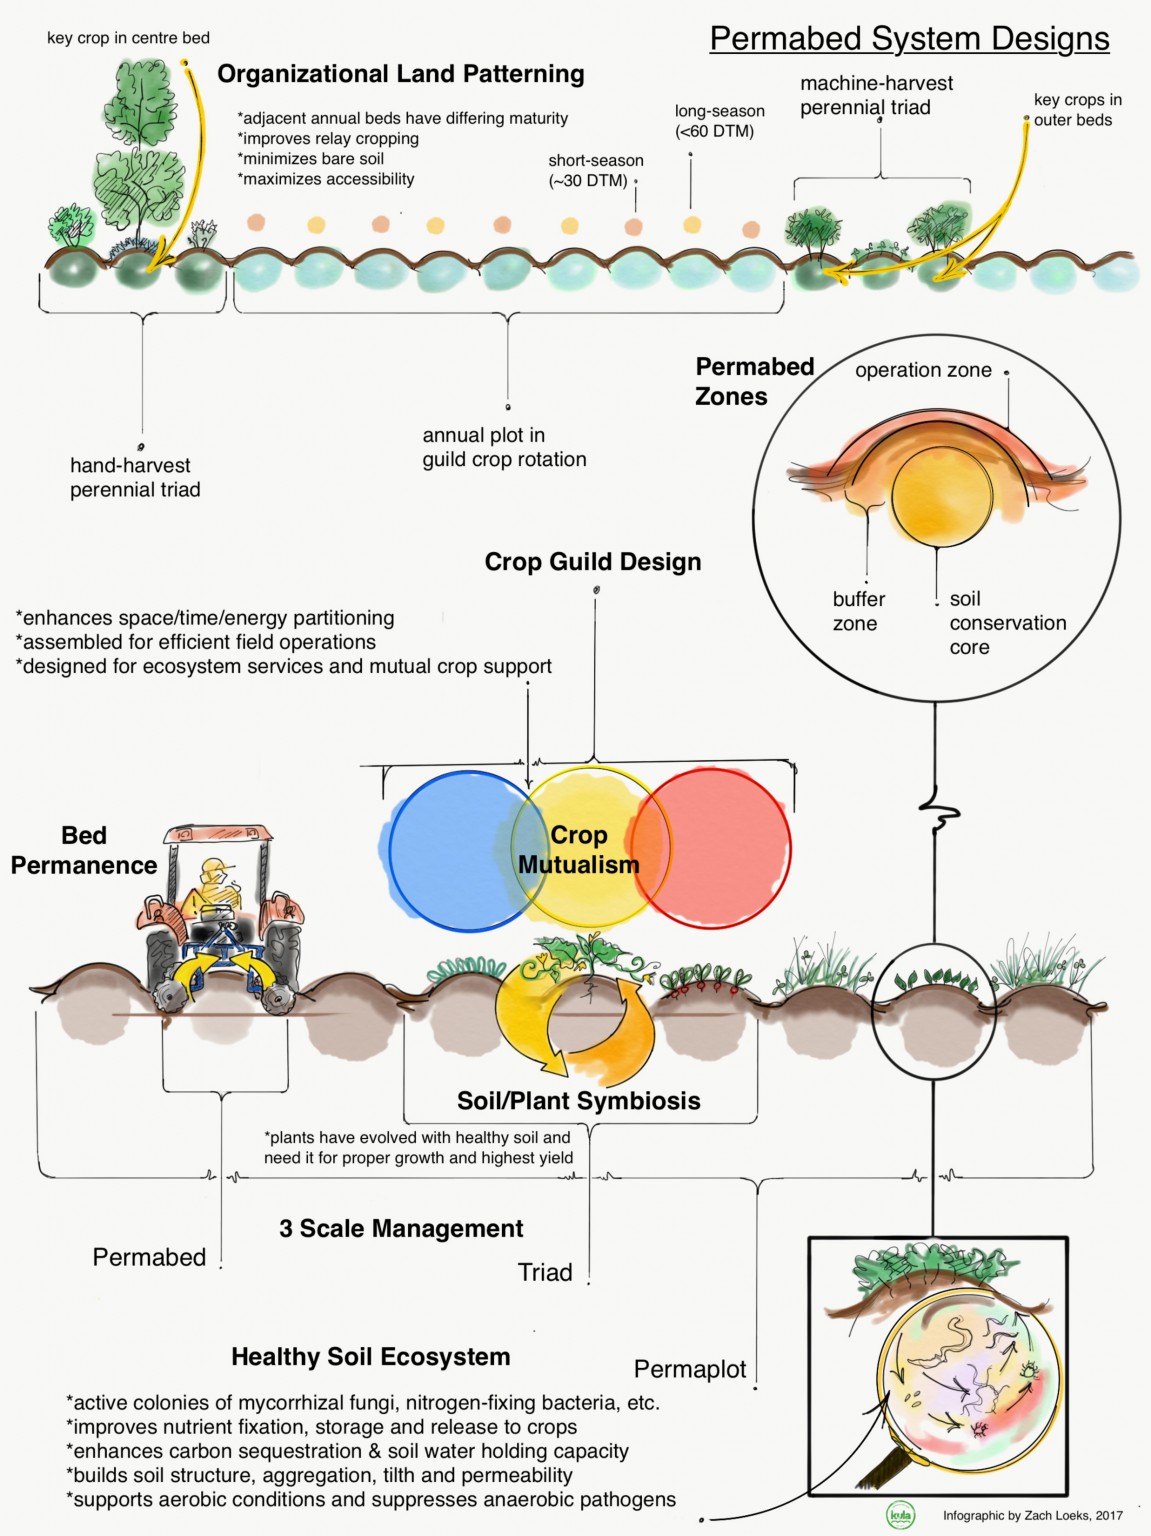 This is the first of a two-part article about using permaculture techniques to improve the profitability and resiliency of market gardens.
.png "The best idea in local farming you’ve never heard of: the “farm stop” with Kathy Sample & Bill Brinkerhoff of Argus Farm Stop")


 If you’ve been a subscriber to Growing For Market (or even if you haven’t), you’re probably familiar with the many advantages of no-till agriculture. No-till methods can reduce a farm’s carbon footprint, promote complex soil biology, and preserve and build organic matter.
 Here's a system to track all those details